
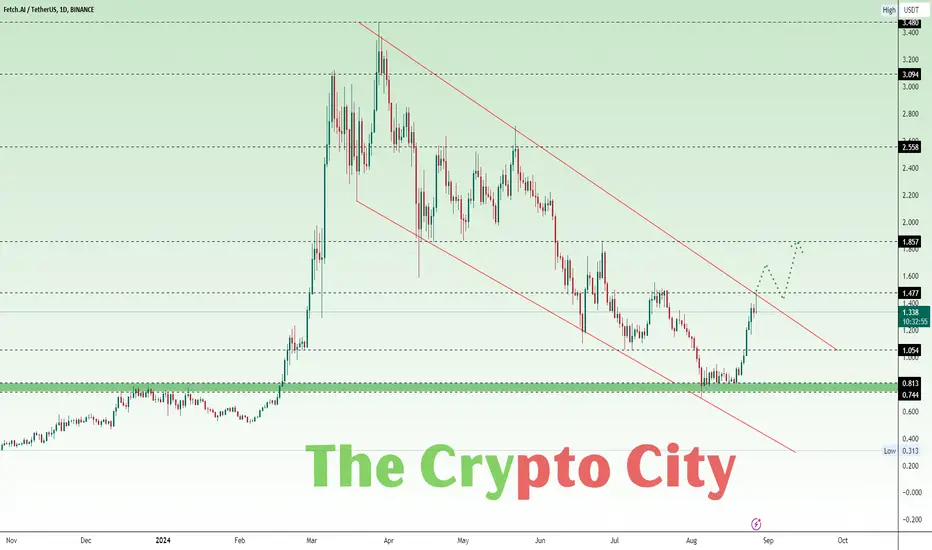
Fetch.AI (FET) has been slowly bouncing back after a big drop, where the price fell from $3.480 to a low of $0.702. Right now, FET is showing some signs of recovery but is still stuck in a downward trend, marked by a descending channel.
The price is currently around $1.331, just below an important resistance level at $1.477. This area is crucial because it aligns with the top of the descending channel. If FET manages to break through this level, it could indicate a shift to a more bullish trend, with potential targets at $1.857, $2.558, $3.094, and $3.480.
However, if FET fails to break above the descending channel's upper trend line and the $1.477 resistance level, it might drop back down to test the lower support levels. The key support zones to keep an eye on are $1.054 and the support zone (Green) at $0.744 - $0.813, which has previously acted as a strong support.
In simple terms, FET is at a turning point. If it breaks above $1.477, we might see a bullish move, but if it doesn't, the price could fall back to test the lower support levels.
액티브 트레이드
FET consolidating above $1.054 support level액티브 트레이드
FET breaks out from the descending channel
면책사항
해당 정보와 게시물은 금융, 투자, 트레이딩 또는 기타 유형의 조언이나 권장 사항으로 간주되지 않으며, 트레이딩뷰에서 제공하거나 보증하는 것이 아닙니다. 자세한 내용은 이용 약관을 참조하세요.
면책사항
해당 정보와 게시물은 금융, 투자, 트레이딩 또는 기타 유형의 조언이나 권장 사항으로 간주되지 않으며, 트레이딩뷰에서 제공하거나 보증하는 것이 아닙니다. 자세한 내용은 이용 약관을 참조하세요.