
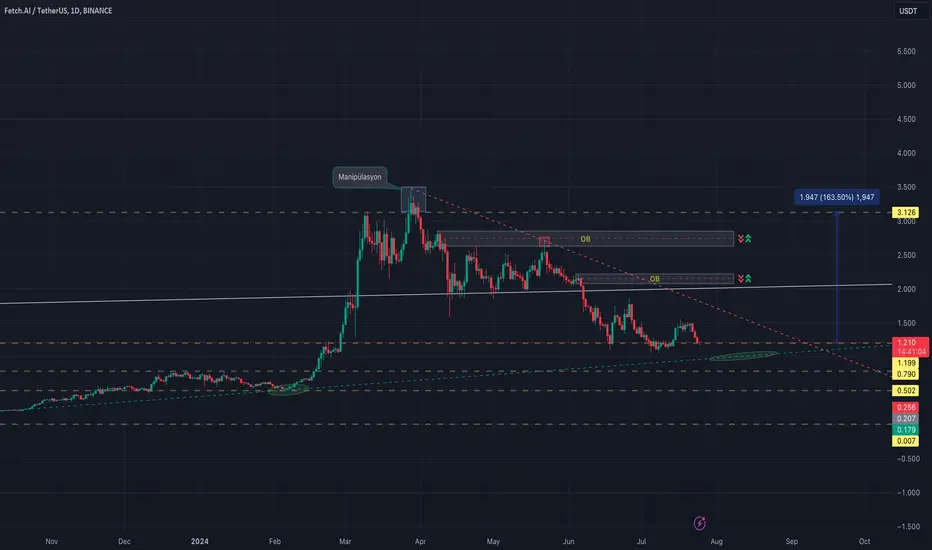
 FET 1D chart;
The $1,199 level is a strong resistance and it seems to be using it as a balance level.
If there is another possible pullback, it may hit the lower trend line.
It is moving towards a narrowing between the trends and it would not be a surprise if it makes an upward move after the squeeze.
We can consider OB levels as possible resistance zones. Therefore, it may make retracements from here.

For more you can follow me on X. @UgurTash
면책사항
해당 정보와 게시물은 금융, 투자, 트레이딩 또는 기타 유형의 조언이나 권장 사항으로 간주되지 않으며, 트레이딩뷰에서 제공하거나 보증하는 것이 아닙니다. 자세한 내용은 이용 약관을 참조하세요.
For more you can follow me on X. @UgurTash
면책사항
해당 정보와 게시물은 금융, 투자, 트레이딩 또는 기타 유형의 조언이나 권장 사항으로 간주되지 않으며, 트레이딩뷰에서 제공하거나 보증하는 것이 아닙니다. 자세한 내용은 이용 약관을 참조하세요.