
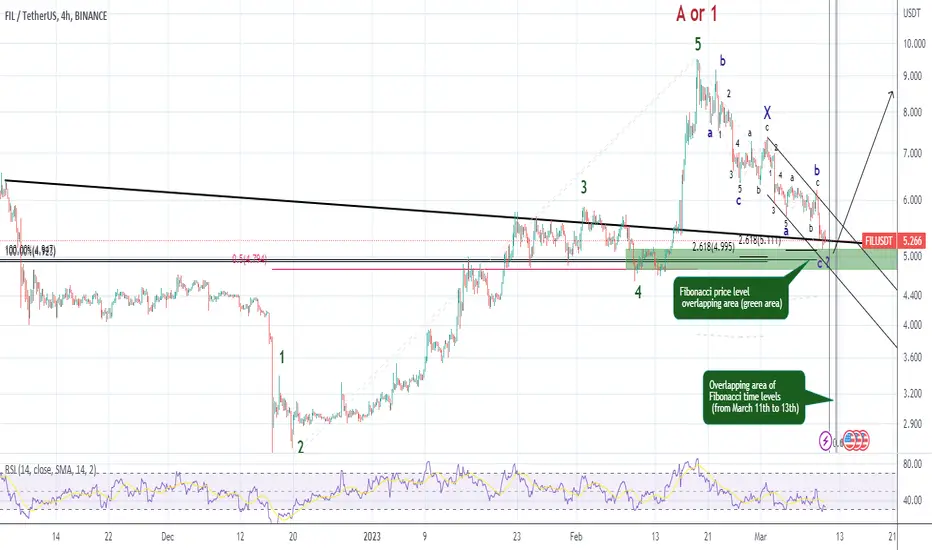
According to the price chart, it is located in the overlapping area of the Fibonacci price levels. And also the price is near a static resistance and a support trend line.
According to the price pattern on the chart, the price is "probably" at the end of its corrective pattern. In my opinion, this correction pattern should end between the 11th and 13th of March.
And the least I expect after the correction pattern ends is for the price to rise to the top of wave A or 1.
But the main targets of this price increase are respectively $20 (100% Fibonacci extension of wave A or 1 from the bottom of the corrective pattern) and $46 (162% Fibonacci extension).
And finally I see $183 (Fibonacci extension 262%).
According to the price pattern on the chart, the price is "probably" at the end of its corrective pattern. In my opinion, this correction pattern should end between the 11th and 13th of March.
And the least I expect after the correction pattern ends is for the price to rise to the top of wave A or 1.
But the main targets of this price increase are respectively $20 (100% Fibonacci extension of wave A or 1 from the bottom of the corrective pattern) and $46 (162% Fibonacci extension).
And finally I see $183 (Fibonacci extension 262%).

면책사항
해당 정보와 게시물은 금융, 투자, 트레이딩 또는 기타 유형의 조언이나 권장 사항으로 간주되지 않으며, 트레이딩뷰에서 제공하거나 보증하는 것이 아닙니다. 자세한 내용은 이용 약관을 참조하세요.
면책사항
해당 정보와 게시물은 금융, 투자, 트레이딩 또는 기타 유형의 조언이나 권장 사항으로 간주되지 않으며, 트레이딩뷰에서 제공하거나 보증하는 것이 아닙니다. 자세한 내용은 이용 약관을 참조하세요.