
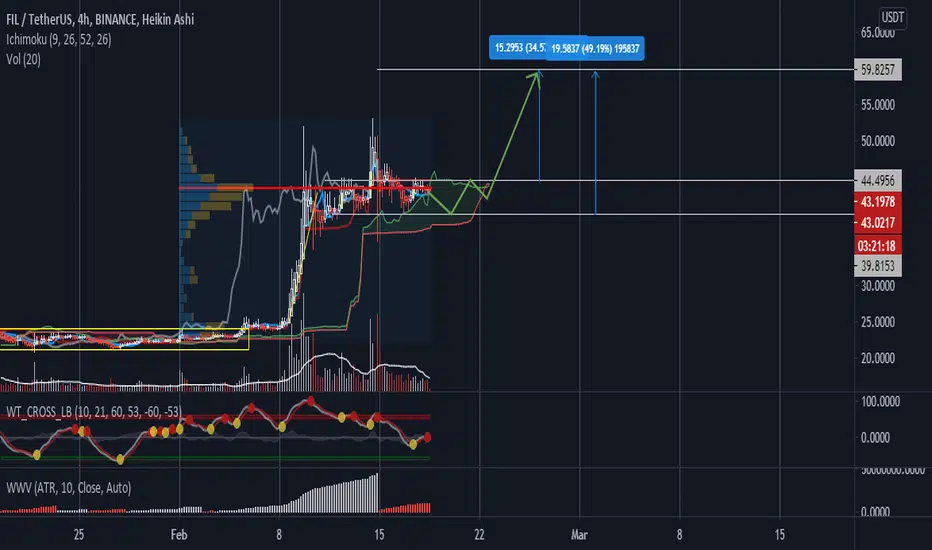
I am looking at FIL in the USDT pair and in a brief analysis I can see an accumulation area that is beginning to show signs of positive disruption.
After a rally that yielded more than 100% gain in value, this asset started to accumulate again (but as the market is sovereign, it can become a distrinution too). So, looking at the volume, I see a decrease in it, which could cause a slight drop before resuming to the bull rally, just as the Weis Wave indicator is still indicating demand on the part of the offer, but in a wave much lower than the previous one.
The WT_CROSS indicator also shows a possible correction before the resumption, just as the Ichimocu Cloud shows me laterality (continuation of accumulation) in the price range between 39,600 and 44,500 USDT which, in my view, would be a good target range description in the graph and target gain percentage.
I emphasize that this is a daydream of mine and it is always good for you to do your own research.

면책사항
해당 정보와 게시물은 금융, 투자, 트레이딩 또는 기타 유형의 조언이나 권장 사항으로 간주되지 않으며, 트레이딩뷰에서 제공하거나 보증하는 것이 아닙니다. 자세한 내용은 이용 약관을 참조하세요.
면책사항
해당 정보와 게시물은 금융, 투자, 트레이딩 또는 기타 유형의 조언이나 권장 사항으로 간주되지 않으며, 트레이딩뷰에서 제공하거나 보증하는 것이 아닙니다. 자세한 내용은 이용 약관을 참조하세요.