
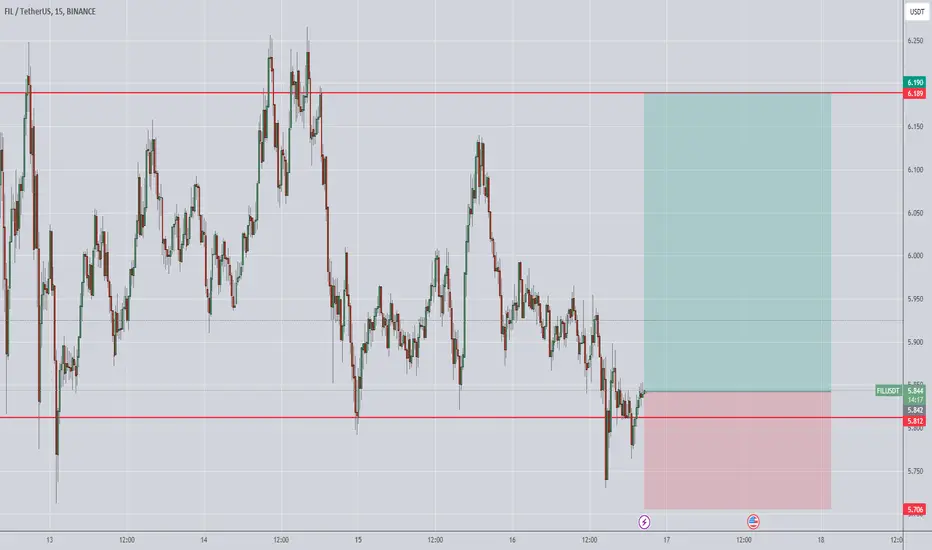
Technical Analysis - FIL/USDT
Timeframe: 4 hours
1. General Trend:
The FIL/USDT pair is currently exhibiting clear signs of an uptrend on the 4-hour chart. This observation is based on price movements over the recent trading sessions.
2. Moving Averages:
Moving averages, especially the 50-period Simple Moving Average (SMA-50), indicate an upward trend. FIL is crossing above the SMA-50, confirming a positive momentum.
3. Support and Resistance Levels:
Previously identified support levels have held, while the pair has successfully breached some key resistance levels. This suggests increased strength on the buyer's side.
4. Technical Indicators:
Relative Strength Index (RSI): The RSI is currently in the overbought zone, indicating strong upward momentum. However, it's essential to monitor any potential divergence for potential reversals.
Moving Average Convergence Divergence (MACD): The MACD shows a signal line above the baseline, confirming an uptrend.
5. Trading Volume:
The recent increase in trading volume accompanies the rise in prices, suggesting heightened participation from traders and investors in the upward trend.
Conclusion:
All indicators currently suggest a positive momentum for the FIL/USDT pair. Traders may consider long positions, taking into account support and resistance levels, as well as overbought indicators to manage risks.
Note: Markets are dynamic, and it's recommended to regularly update your technical analysis based on market developments.
Timeframe: 4 hours
1. General Trend:
The FIL/USDT pair is currently exhibiting clear signs of an uptrend on the 4-hour chart. This observation is based on price movements over the recent trading sessions.
2. Moving Averages:
Moving averages, especially the 50-period Simple Moving Average (SMA-50), indicate an upward trend. FIL is crossing above the SMA-50, confirming a positive momentum.
3. Support and Resistance Levels:
Previously identified support levels have held, while the pair has successfully breached some key resistance levels. This suggests increased strength on the buyer's side.
4. Technical Indicators:
Relative Strength Index (RSI): The RSI is currently in the overbought zone, indicating strong upward momentum. However, it's essential to monitor any potential divergence for potential reversals.
Moving Average Convergence Divergence (MACD): The MACD shows a signal line above the baseline, confirming an uptrend.
5. Trading Volume:
The recent increase in trading volume accompanies the rise in prices, suggesting heightened participation from traders and investors in the upward trend.
Conclusion:
All indicators currently suggest a positive momentum for the FIL/USDT pair. Traders may consider long positions, taking into account support and resistance levels, as well as overbought indicators to manage risks.
Note: Markets are dynamic, and it's recommended to regularly update your technical analysis based on market developments.

면책사항
해당 정보와 게시물은 금융, 투자, 트레이딩 또는 기타 유형의 조언이나 권장 사항으로 간주되지 않으며, 트레이딩뷰에서 제공하거나 보증하는 것이 아닙니다. 자세한 내용은 이용 약관을 참조하세요.
면책사항
해당 정보와 게시물은 금융, 투자, 트레이딩 또는 기타 유형의 조언이나 권장 사항으로 간주되지 않으며, 트레이딩뷰에서 제공하거나 보증하는 것이 아닙니다. 자세한 내용은 이용 약관을 참조하세요.