
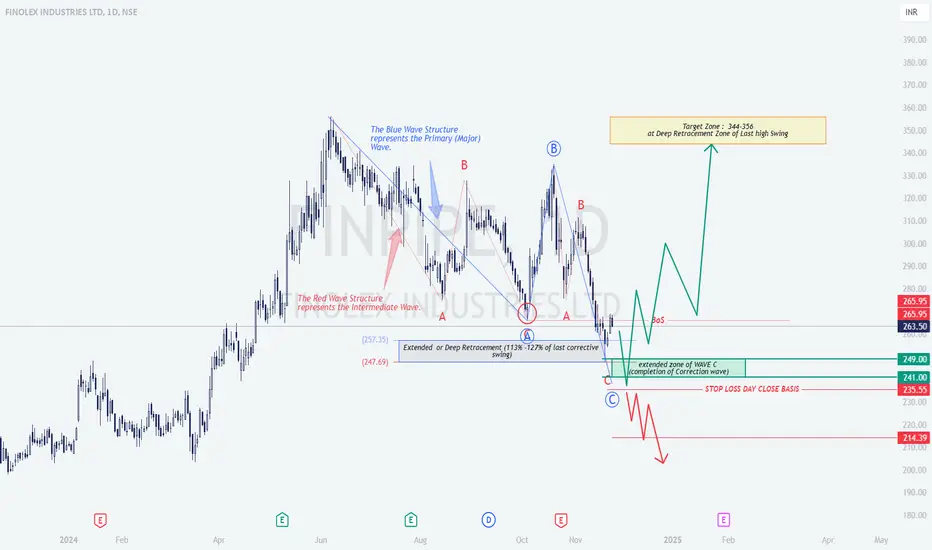
Finolex Industries Ltd: Wave Structure and Fibonacci Confluence Analysis
1. Overview
This chart analysis of Finolex Industries Ltd leverages Elliott Wave Theory and Fibonacci retracement zones to identify high-probability price movements. It captures the interaction of a primary wave (blue) and an intermediate wave (red), providing insight into the potential price reversal and future targets.
2. Technical Breakdown
Wave B: Forms a minor retracement, lacking strong upward momentum.
Wave C: Extended downward move, aligning with the critical retracement zone of 113%–127% Fibonacci.
3. Logical Interpretation of Price Action
4. Strategy Recommendations
Entry Points:
Targets:
Stop-Loss:
Alternative Scenario:
5. Educational Insights
6. Summary
This analysis of Finolex Industries Ltd combines Elliott Wave Theory and Fibonacci retracements to outline a potential bullish scenario. The setup offers a clear risk-reward strategy for traders, emphasizing key zones like the ₹241–₹249 support area and the ₹344–₹356 target zone. Adopting disciplined risk management with stop-loss placement ensures effective trade execution in a volatile market.
1. Overview
This chart analysis of Finolex Industries Ltd leverages Elliott Wave Theory and Fibonacci retracement zones to identify high-probability price movements. It captures the interaction of a primary wave (blue) and an intermediate wave (red), providing insight into the potential price reversal and future targets.
2. Technical Breakdown
Wave B: Forms a minor retracement, lacking strong upward momentum.
Wave C: Extended downward move, aligning with the critical retracement zone of 113%–127% Fibonacci.
3. Logical Interpretation of Price Action
4. Strategy Recommendations
Entry Points:
Targets:
Stop-Loss:
Alternative Scenario:
5. Educational Insights
6. Summary
This analysis of Finolex Industries Ltd combines Elliott Wave Theory and Fibonacci retracements to outline a potential bullish scenario. The setup offers a clear risk-reward strategy for traders, emphasizing key zones like the ₹241–₹249 support area and the ₹344–₹356 target zone. Adopting disciplined risk management with stop-loss placement ensures effective trade execution in a volatile market.

면책사항
해당 정보와 게시물은 금융, 투자, 트레이딩 또는 기타 유형의 조언이나 권장 사항으로 간주되지 않으며, 트레이딩뷰에서 제공하거나 보증하는 것이 아닙니다. 자세한 내용은 이용 약관을 참조하세요.
면책사항
해당 정보와 게시물은 금융, 투자, 트레이딩 또는 기타 유형의 조언이나 권장 사항으로 간주되지 않으며, 트레이딩뷰에서 제공하거나 보증하는 것이 아닙니다. 자세한 내용은 이용 약관을 참조하세요.