
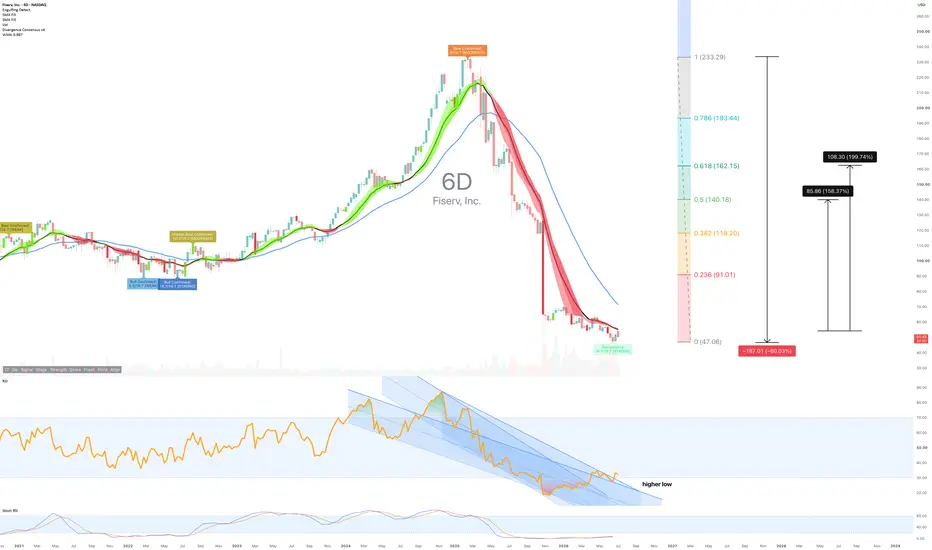
SYMBOL: BMV:FISV | DIRECTION: NEUTRAL | TIMEFRAME: Weekly
Published: July 2026
Ever get the feeling you’re not loved?
Not twelve months ago Fiserv was a $127.4billion market cap. Then they went on a money spending spree. Perhaps they got a good teaser rate on that new shinny credit card?
Today at $26.90 billion market cap and a $29.31 billion debt, Fiserv has more in common with a penny stock than pretending to masquerade as an established business.
While $29 billion is a massive number, credit rating agencies and institutional investors aren't overly panicked for a few key reasons. Fiserv's heavy debt load boils down to a classic private equity backstory and a specific business model.
1. The $17 Billion Inheritance (The First Data Merger)
2. Aggressive FinTech Acquisitions & Share Buybacks. Doh.
So, it’s all roses?
Not quite.
The collapse of Fiserv’s stock price (from its peak near $170 down to the $50 range) over the past 12 to 18 months was triggered by a corporate "perfect storm." The company was hit by a massive earnings shock, sudden management turnover, and the revelation that previous leadership had been artificially boosting short-term profits at the expense of long-term health. And I thought Crypto bros were king of the fixer uppers.
In fact, if the business continues to operate as it has done recently, then the future is bleak. Are you an employee? Brush up that CV before your co-workers read this post.. the chart is printing red flags on every corner for those that care to look.
Fiserv has dropped seventy three percent from its fifty two week high. The chart looks like someone took a sledgehammer to it. Lower highs, lower lows, with price now sitting at the third percentile of its annual range. The selling pressure remains genuine. Volume is expanding on down moves, which means the people doing the dumping know something. I.e. the business is.. (insert your preferred expletive).
And yet.
Daily through weekly charts print a strong regular bullish divergence. 16 from18 oscillators are in agreement. RSI on the weekly has collapsed to 34.9, deeply oversold territory. The price structure has triggered an internal balance condition that historically rotates upward with high probability. The tension is real: short term reversal mechanics are lining up against a backdrop of structural decay.
Where’s the money making part?
Bear with me..
On the above 6 day chart Fiserv Inc has triggered a high probability rotation setup whilst maintaining an intact downtrend structure. Three reasons now exist to watch for a near term trade, not an investment.
They include:
1. Daily through weekly regular bullish divergence.
The momentum indicator has fallen deeper than price, a classic reversal signal. Does the crowd ever believe a reversal when the macro picture is this bleak?
2. Internal balance trigger with high probability condition.
Price has rotated into a zone where historical behaviour favours upward movement. This is a near term trade structure, not a fundamental recovery. The setup exists independent of whether the downtrend resumes.
3. Weekly RSI at thirty four point nine: deeply oversold.
The weekly momentum oscillator sits in territory that has historically preceded at least a corrective bounce.
Now the danger:
One caveat worth acknowledging: the bigger picture remains structurally ugly. A breakdown of annual moving average across most equities has historically preceded ten or more years of bear market behaviour. Fiserv has already done the damage. This setup is a trade into what may be a secular downtrend, not a reversal of it. The probability of a move is high. The probability of this becoming an investment is low. You are trading gravity on pause, not gravity reversed.
Annual moving average breakdown

Targets
1st and 2nd targets are basically market structure that oddly enough align with Fibonacci levels:
1st: 160% at $140 area
2nd: 200% at $160 area
The crowd
The consensus is divided. The technical analysts see oversold conditions and are whispering about bounces. The macro observers are silent, having already written this one off as a victim of whatever regime is now in charge. Most traders will sit in the fear of the bigger picture and miss the counter move entirely. They are wrong about timing, not direction. This trade exists in the gap between "this is a dying stock" and "this is oversold this week." Both things are true.
The chart started it. I am simply reporting back.
Good luck.
Ww
Type: Intraday to swing | Timeframe: Weekly
===================================================
Disclaimer
Isn't it amazing you're getting this for cheap? Top notch quality info without cost, what's my angle? You're in luck, I just like studying data. A study that'll continue until the overgrown garden demands my attention.
In the meantime, this idea is for educational and informational purposes only. It is not financial advice. Equities involve significant risk. Always do your own research and consult a qualified financial adviser before making any investment decisions. Past performance is not indicative of future results.
Published: July 2026
Ever get the feeling you’re not loved?
Not twelve months ago Fiserv was a $127.4billion market cap. Then they went on a money spending spree. Perhaps they got a good teaser rate on that new shinny credit card?
Today at $26.90 billion market cap and a $29.31 billion debt, Fiserv has more in common with a penny stock than pretending to masquerade as an established business.
While $29 billion is a massive number, credit rating agencies and institutional investors aren't overly panicked for a few key reasons. Fiserv's heavy debt load boils down to a classic private equity backstory and a specific business model.
1. The $17 Billion Inheritance (The First Data Merger)
2. Aggressive FinTech Acquisitions & Share Buybacks. Doh.
So, it’s all roses?
Not quite.
The collapse of Fiserv’s stock price (from its peak near $170 down to the $50 range) over the past 12 to 18 months was triggered by a corporate "perfect storm." The company was hit by a massive earnings shock, sudden management turnover, and the revelation that previous leadership had been artificially boosting short-term profits at the expense of long-term health. And I thought Crypto bros were king of the fixer uppers.
In fact, if the business continues to operate as it has done recently, then the future is bleak. Are you an employee? Brush up that CV before your co-workers read this post.. the chart is printing red flags on every corner for those that care to look.
Fiserv has dropped seventy three percent from its fifty two week high. The chart looks like someone took a sledgehammer to it. Lower highs, lower lows, with price now sitting at the third percentile of its annual range. The selling pressure remains genuine. Volume is expanding on down moves, which means the people doing the dumping know something. I.e. the business is.. (insert your preferred expletive).
And yet.
Daily through weekly charts print a strong regular bullish divergence. 16 from18 oscillators are in agreement. RSI on the weekly has collapsed to 34.9, deeply oversold territory. The price structure has triggered an internal balance condition that historically rotates upward with high probability. The tension is real: short term reversal mechanics are lining up against a backdrop of structural decay.
Where’s the money making part?
Bear with me..
On the above 6 day chart Fiserv Inc has triggered a high probability rotation setup whilst maintaining an intact downtrend structure. Three reasons now exist to watch for a near term trade, not an investment.
They include:
1. Daily through weekly regular bullish divergence.
The momentum indicator has fallen deeper than price, a classic reversal signal. Does the crowd ever believe a reversal when the macro picture is this bleak?
2. Internal balance trigger with high probability condition.
Price has rotated into a zone where historical behaviour favours upward movement. This is a near term trade structure, not a fundamental recovery. The setup exists independent of whether the downtrend resumes.
3. Weekly RSI at thirty four point nine: deeply oversold.
The weekly momentum oscillator sits in territory that has historically preceded at least a corrective bounce.
Now the danger:
One caveat worth acknowledging: the bigger picture remains structurally ugly. A breakdown of annual moving average across most equities has historically preceded ten or more years of bear market behaviour. Fiserv has already done the damage. This setup is a trade into what may be a secular downtrend, not a reversal of it. The probability of a move is high. The probability of this becoming an investment is low. You are trading gravity on pause, not gravity reversed.
Annual moving average breakdown
Targets
1st and 2nd targets are basically market structure that oddly enough align with Fibonacci levels:
1st: 160% at $140 area
2nd: 200% at $160 area
The crowd
The consensus is divided. The technical analysts see oversold conditions and are whispering about bounces. The macro observers are silent, having already written this one off as a victim of whatever regime is now in charge. Most traders will sit in the fear of the bigger picture and miss the counter move entirely. They are wrong about timing, not direction. This trade exists in the gap between "this is a dying stock" and "this is oversold this week." Both things are true.
The chart started it. I am simply reporting back.
Good luck.
Ww
Type: Intraday to swing | Timeframe: Weekly
===================================================
Disclaimer
Isn't it amazing you're getting this for cheap? Top notch quality info without cost, what's my angle? You're in luck, I just like studying data. A study that'll continue until the overgrown garden demands my attention.
In the meantime, this idea is for educational and informational purposes only. It is not financial advice. Equities involve significant risk. Always do your own research and consult a qualified financial adviser before making any investment decisions. Past performance is not indicative of future results.
액티브 트레이드
노트
Take advantage.
면책사항
해당 정보와 게시물은 금융, 투자, 트레이딩 또는 기타 유형의 조언이나 권장 사항으로 간주되지 않으며, 트레이딩뷰에서 제공하거나 보증하는 것이 아닙니다. 자세한 내용은 이용 약관을 참조하세요.
면책사항
해당 정보와 게시물은 금융, 투자, 트레이딩 또는 기타 유형의 조언이나 권장 사항으로 간주되지 않으며, 트레이딩뷰에서 제공하거나 보증하는 것이 아닙니다. 자세한 내용은 이용 약관을 참조하세요.