
📈 Current Price Context (approx)
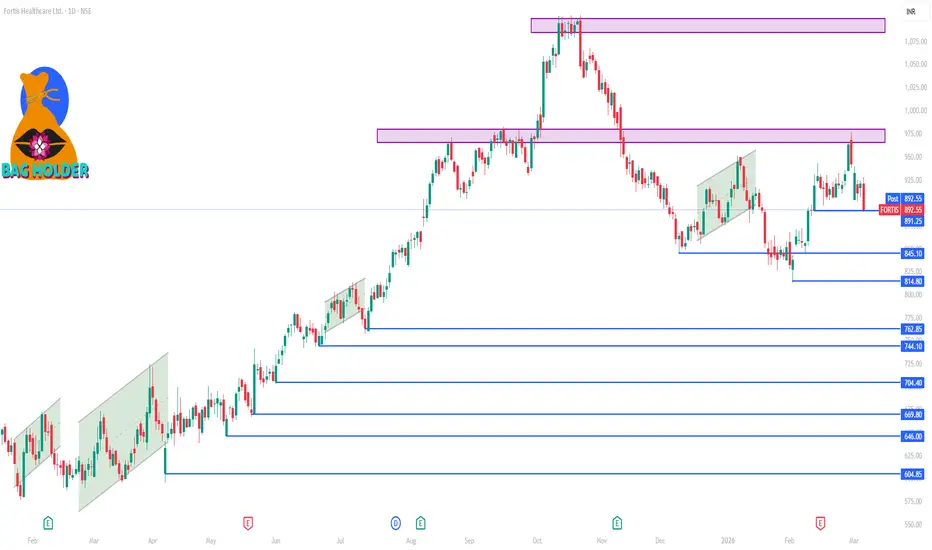
The stock has been trading recently around ₹890–930 on the NSE/BSE range, with 52‑week high ~₹1,104 and low ~₹595**.
📊 Key Levels for the 1‑Week Time Frame
🔹 Resistance Zones
These are levels where price has historically faced selling pressure and may struggle to move above in the short run:
₹927–₹934 – First resistance zone near recent pivot resistance.
₹939–₹946 – Next larger upside barrier.
₹950+ – Break above this puts focus toward the recent 52‑week high cluster.
🔸 Support Zones
Buying interest historically appears when price dips toward these zones:
₹900–₹910 – Near near‑term support/pivot zone (also recent intra‑week pivot).
₹890–₹898 – Lower support cluster near short‑term averages.
₹870–₹880 – Broader cushion from 200‑day MA and previous swing lows.
📌 What This Means in a 1‑Week Trading Frame
Neutral to modest bullish bias around pivot levels near ₹900–₹910; sustaining above this could allow tests of resistance ~₹927–₹946.
If price breaks below ₹890–₹880, further downside toward mid‑term support ~₹860–₹870 becomes more likely.
Oscillators like RSI/Stoch are currently in neutral/above average range — not strongly overbought yet — suggesting limited immediate exhaustion.
📍 Summary Levels (1‑Week Focus)
Category Zone
Immediate Support ₹900 – ₹910
Secondary Support ₹890 – ₹880
First Resistance ₹927 – ₹934
Primary Resistance ₹939 – ₹946
The stock has been trading recently around ₹890–930 on the NSE/BSE range, with 52‑week high ~₹1,104 and low ~₹595**.
📊 Key Levels for the 1‑Week Time Frame
🔹 Resistance Zones
These are levels where price has historically faced selling pressure and may struggle to move above in the short run:
₹927–₹934 – First resistance zone near recent pivot resistance.
₹939–₹946 – Next larger upside barrier.
₹950+ – Break above this puts focus toward the recent 52‑week high cluster.
🔸 Support Zones
Buying interest historically appears when price dips toward these zones:
₹900–₹910 – Near near‑term support/pivot zone (also recent intra‑week pivot).
₹890–₹898 – Lower support cluster near short‑term averages.
₹870–₹880 – Broader cushion from 200‑day MA and previous swing lows.
📌 What This Means in a 1‑Week Trading Frame
Neutral to modest bullish bias around pivot levels near ₹900–₹910; sustaining above this could allow tests of resistance ~₹927–₹946.
If price breaks below ₹890–₹880, further downside toward mid‑term support ~₹860–₹870 becomes more likely.
Oscillators like RSI/Stoch are currently in neutral/above average range — not strongly overbought yet — suggesting limited immediate exhaustion.
📍 Summary Levels (1‑Week Focus)
Category Zone
Immediate Support ₹900 – ₹910
Secondary Support ₹890 – ₹880
First Resistance ₹927 – ₹934
Primary Resistance ₹939 – ₹946

Contact Knowledgehub for a detailed consultation: Dm on WhatsApp: [wa.link/a2o0kz]-
Phone No: [+91 93102 26243]-
Email: [tradingviewknowledgehub@gmail.com]---
-- Let’s achieve success together!
Phone No: [+91 93102 26243]-
Email: [tradingviewknowledgehub@gmail.com]---
-- Let’s achieve success together!
관련 발행물
면책사항
해당 정보와 게시물은 금융, 투자, 트레이딩 또는 기타 유형의 조언이나 권장 사항으로 간주되지 않으며, 트레이딩뷰에서 제공하거나 보증하는 것이 아닙니다. 자세한 내용은 이용 약관을 참조하세요.
Contact Knowledgehub for a detailed consultation: Dm on WhatsApp: [wa.link/a2o0kz]-
Phone No: [+91 93102 26243]-
Email: [tradingviewknowledgehub@gmail.com]---
-- Let’s achieve success together!
Phone No: [+91 93102 26243]-
Email: [tradingviewknowledgehub@gmail.com]---
-- Let’s achieve success together!
관련 발행물
면책사항
해당 정보와 게시물은 금융, 투자, 트레이딩 또는 기타 유형의 조언이나 권장 사항으로 간주되지 않으며, 트레이딩뷰에서 제공하거나 보증하는 것이 아닙니다. 자세한 내용은 이용 약관을 참조하세요.