롱
Can FSR move higher? LONG
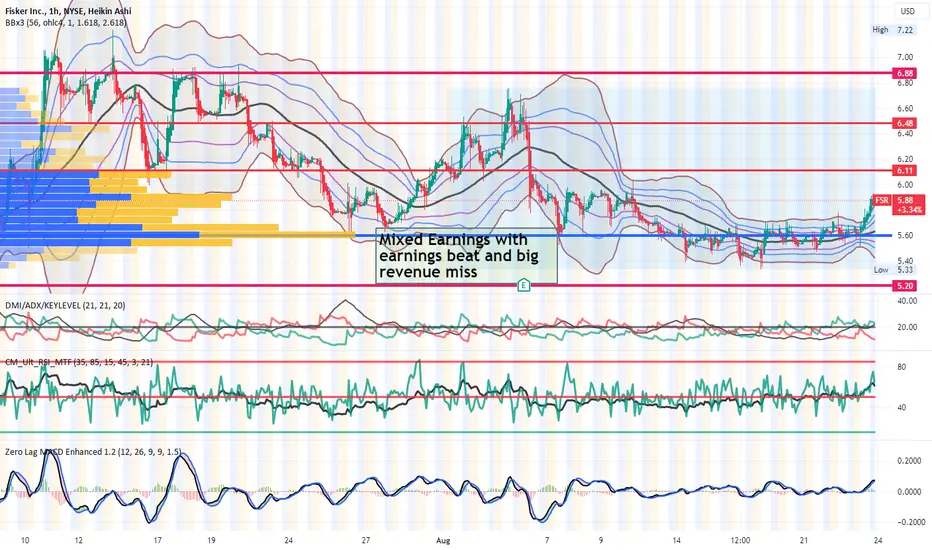
FSR on the one hour chart fell from a triple top in mid July into the lower range
of the volume profile's high volume area then bounced higher in a series of higher
highs but then rolled over and fell again/ It has consolidated sideways about
that POC line and now is above it. The indicators including Directional Index
Zero Lag MACD and dual time frame RSI all indicate a return to bullish momentum.
I will take a long trade the horizontal levels on the chart served as tiered targets
for a risk managed trade. I will take some call options contracts as well. I think FSR
may follow the market leader in TSLA for a bit.
액티브 트레이드
Today is another add day.
면책사항
해당 정보와 게시물은 금융, 투자, 트레이딩 또는 기타 유형의 조언이나 권장 사항으로 간주되지 않으며, 트레이딩뷰에서 제공하거나 보증하는 것이 아닙니다. 자세한 내용은 이용 약관을 참조하세요.
면책사항
해당 정보와 게시물은 금융, 투자, 트레이딩 또는 기타 유형의 조언이나 권장 사항으로 간주되지 않으며, 트레이딩뷰에서 제공하거나 보증하는 것이 아닙니다. 자세한 내용은 이용 약관을 참조하세요.