롱
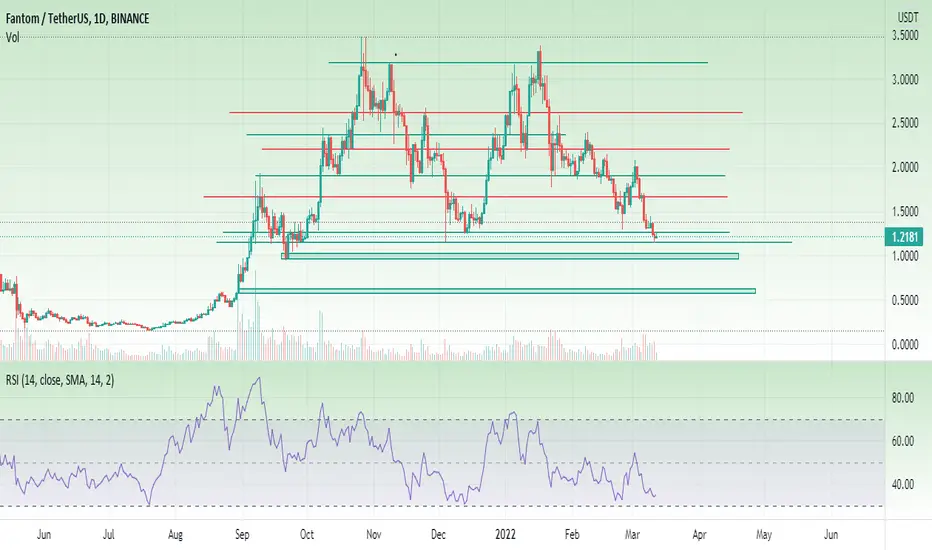
FTM/USDT Chart
Hi, I try to post often so if you could follow and like it would mean a lot to me. I am also posting SOL and LUNA charts today.
After being very bullish during december and january, FTM became one of the most weak altcoins (at least for now). Well this is for a fact on of the things that describe altcoin markets. Small-mid cap coins have a consistent run and then just full correct to their bottom price. CRV had a similar run, but for now let's pay attention to FTM.
FTM has a bullish divergence on the 1D and in the 4H chart. The RSI on the lower time frames shows that this might be the bottom for the coin in the mid term. We already got rejected at the 1.14$ support and I expect the coin to up to 1.50$. Then we will see. I don't see BTC crashing hard in the next days, and that's a evident factor to let alts perform. Trading right now is very risky so be careful with your portfolio changes. Comment what you think and check out my other ideas.
I stream weekly on TradingView, and my next stream is on Friday at 4 pm UK time. Be there!

면책사항
해당 정보와 게시물은 금융, 투자, 트레이딩 또는 기타 유형의 조언이나 권장 사항으로 간주되지 않으며, 트레이딩뷰에서 제공하거나 보증하는 것이 아닙니다. 자세한 내용은 이용 약관을 참조하세요.
면책사항
해당 정보와 게시물은 금융, 투자, 트레이딩 또는 기타 유형의 조언이나 권장 사항으로 간주되지 않으며, 트레이딩뷰에서 제공하거나 보증하는 것이 아닙니다. 자세한 내용은 이용 약관을 참조하세요.