롱
FTM/USDT: Wave Pattern Signals Potential 80% Upside | Key Levels
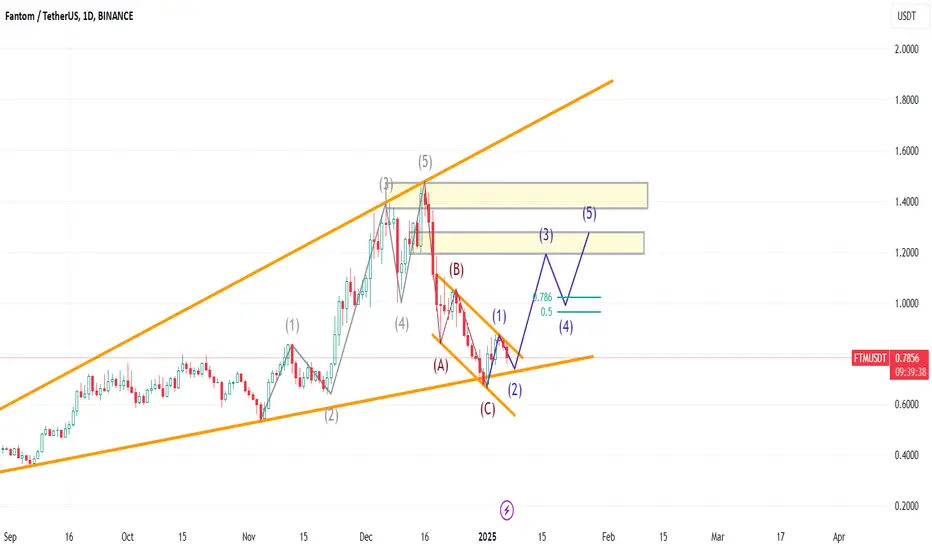
Technical Analysis:
1. Price is currently at $0.7892, down 4.63%
2. Wave structure suggests completion of ABC correction at point (C)
3. Fibonacci retracement level at 0.786 aligns with potential reversal zone
4. Two target zones identified:
- First target: ~$1.20-1.30 (Wave 3)
- Second target: ~$1.30-1.50 (Wave 5)
Trading Setup:
- Entry zone: $0.75-0.78
- Stop loss: Below point (C) around $0.70
- Risk:reward ratio approximately 1:3 for first target
Key Points:
- Bullish divergence forming at current levels
- Price testing ascending trendline support
- Wave structure suggests start of new impulsive wave up
Caution:
- Wait for confirmation of reversal with price action
- Consider position sizing due to crypto market volatility
- Monitor BTC correlation for trade validation

관련 발행물
면책사항
해당 정보와 게시물은 금융, 투자, 트레이딩 또는 기타 유형의 조언이나 권장 사항으로 간주되지 않으며, 트레이딩뷰에서 제공하거나 보증하는 것이 아닙니다. 자세한 내용은 이용 약관을 참조하세요.
관련 발행물
면책사항
해당 정보와 게시물은 금융, 투자, 트레이딩 또는 기타 유형의 조언이나 권장 사항으로 간주되지 않으며, 트레이딩뷰에서 제공하거나 보증하는 것이 아닙니다. 자세한 내용은 이용 약관을 참조하세요.