롱
Fantom/usdt
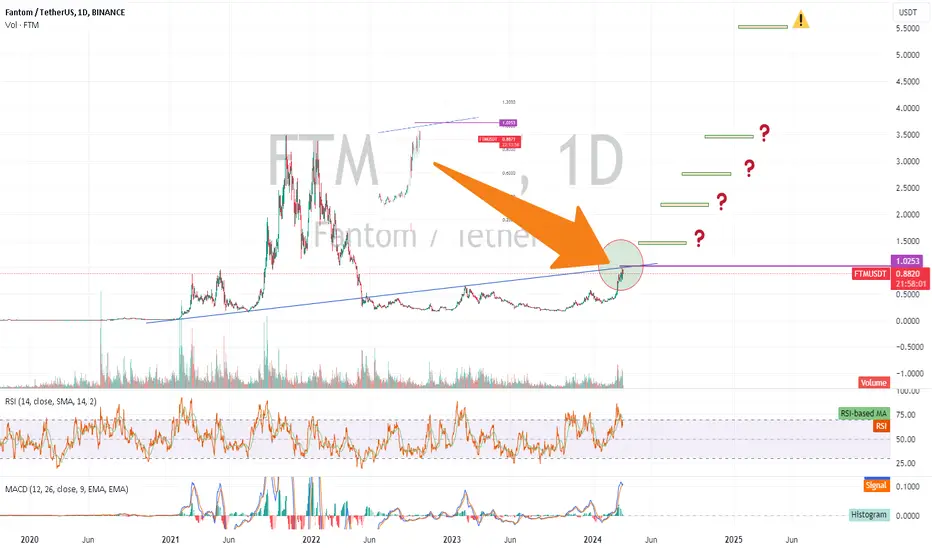
Best Chart You can see today
fantom looks really interesting but we need just a breakout the trend ( as chart shows ) and close above with daily candle & high volume
Target on chart Starting from 1.5$ to 3.5$
for 5.5$ maybe it will take couple of months
this is a personal opinion and NFA
Thank you
fantom looks really interesting but we need just a breakout the trend ( as chart shows ) and close above with daily candle & high volume
Target on chart Starting from 1.5$ to 3.5$
for 5.5$ maybe it will take couple of months
this is a personal opinion and NFA
Thank you
액티브 트레이드
FTM Daily & Weekly Chart Ultra Bullish & we are about reaching our first target 1.45$-1.47$액티브 트레이드
Cause of market correction ftm it may fall bellow 1$ again , we need to pay attention if you are invester ( long term trader ) that's means your targets still active & if you are daily trader you need to make your stop lost daily close bellow 1$ good luck everyone
거래청산: 스탑 닿음
stop lost reached replace buying order btw 0.7$ - 0.85$
면책사항
해당 정보와 게시물은 금융, 투자, 트레이딩 또는 기타 유형의 조언이나 권장 사항으로 간주되지 않으며, 트레이딩뷰에서 제공하거나 보증하는 것이 아닙니다. 자세한 내용은 이용 약관을 참조하세요.
면책사항
해당 정보와 게시물은 금융, 투자, 트레이딩 또는 기타 유형의 조언이나 권장 사항으로 간주되지 않으며, 트레이딩뷰에서 제공하거나 보증하는 것이 아닙니다. 자세한 내용은 이용 약관을 참조하세요.