FTM's Rise
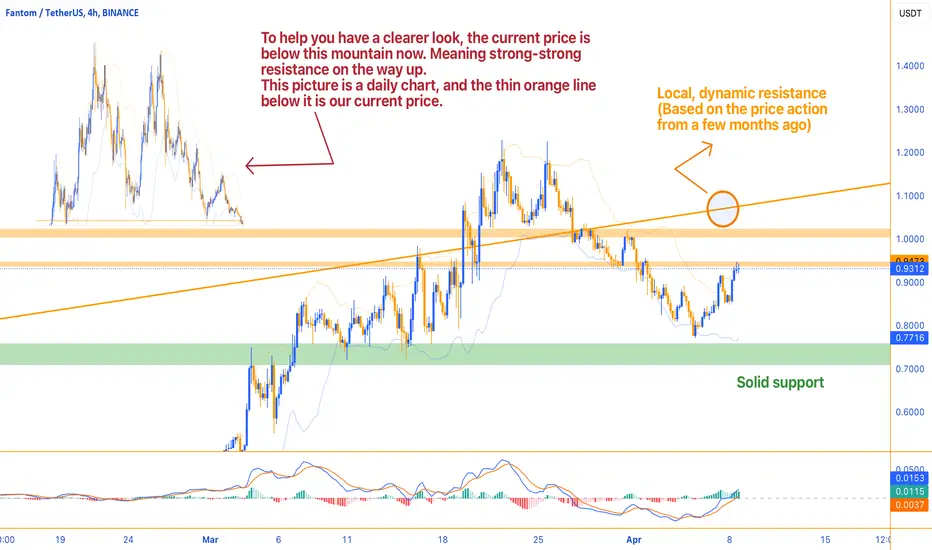
Fantom (FTM) has been showcasing an interesting price development, currently trading at $0.9297. On the 4-hour chart, FTM's recent climb shows it's approaching a local, dynamic resistance level which may indicate a near-term challenge for the price to push higher.
The Bollinger Bands reveal that the price is nearing the upper band, which can often act as a short-term resistance. This proximity to the upper band at $0.9473 might suggest a potential for either a temporary pullback or, if the price breaks through, a continuation of the bullish trend.
The trading volume for FTM is healthy at 11.604M, which underscores a decent level of trader interest at these prices. The Moving Average (MA) at $0.8966 is below the current price, indicating that the recent price action is still favored by a bullish bias.
The MACD histogram is positive, albeit marginally, with the MACD line slightly above the signal line, hinting at a continuing bullish momentum but cautioning that it may not be particularly strong at the moment.
Stochastic Oscillator values are high, indicating that the price might be in overbought territory, which sometimes leads to a subsequent price correction as the market consolidates.
Finally, the Relative Strength Index (RSI) is above its MA and remains in a healthy range without showing signs of being overbought. This suggests there might be some room for the price to go up before facing selling pressure due to being overbought.
In summary, Fantom's market dynamics are showing signs of a bullish trend, but as it nears the dynamic resistance level, traders will likely watch to see if it has the strength to break through or if it will retreat and consolidate before making another move.
The Bollinger Bands reveal that the price is nearing the upper band, which can often act as a short-term resistance. This proximity to the upper band at $0.9473 might suggest a potential for either a temporary pullback or, if the price breaks through, a continuation of the bullish trend.
The trading volume for FTM is healthy at 11.604M, which underscores a decent level of trader interest at these prices. The Moving Average (MA) at $0.8966 is below the current price, indicating that the recent price action is still favored by a bullish bias.
The MACD histogram is positive, albeit marginally, with the MACD line slightly above the signal line, hinting at a continuing bullish momentum but cautioning that it may not be particularly strong at the moment.
Stochastic Oscillator values are high, indicating that the price might be in overbought territory, which sometimes leads to a subsequent price correction as the market consolidates.
Finally, the Relative Strength Index (RSI) is above its MA and remains in a healthy range without showing signs of being overbought. This suggests there might be some room for the price to go up before facing selling pressure due to being overbought.
In summary, Fantom's market dynamics are showing signs of a bullish trend, but as it nears the dynamic resistance level, traders will likely watch to see if it has the strength to break through or if it will retreat and consolidate before making another move.

Join the free Telegram channel
💎 Telegram Channel: t.me/MonoCoin_Public
🔔 Bot: t.me/MonoCoinSignal_Bot?start=starter_tv
🌐 Website: MonoCoin.net
⭐️ 5-Star TrustPilot: trustpilot.com/review/monocoin.net
💎 Telegram Channel: t.me/MonoCoin_Public
🔔 Bot: t.me/MonoCoinSignal_Bot?start=starter_tv
🌐 Website: MonoCoin.net
⭐️ 5-Star TrustPilot: trustpilot.com/review/monocoin.net
관련 발행물
면책사항
해당 정보와 게시물은 금융, 투자, 트레이딩 또는 기타 유형의 조언이나 권장 사항으로 간주되지 않으며, 트레이딩뷰에서 제공하거나 보증하는 것이 아닙니다. 자세한 내용은 이용 약관을 참조하세요.
Join the free Telegram channel
💎 Telegram Channel: t.me/MonoCoin_Public
🔔 Bot: t.me/MonoCoinSignal_Bot?start=starter_tv
🌐 Website: MonoCoin.net
⭐️ 5-Star TrustPilot: trustpilot.com/review/monocoin.net
💎 Telegram Channel: t.me/MonoCoin_Public
🔔 Bot: t.me/MonoCoinSignal_Bot?start=starter_tv
🌐 Website: MonoCoin.net
⭐️ 5-Star TrustPilot: trustpilot.com/review/monocoin.net
관련 발행물
면책사항
해당 정보와 게시물은 금융, 투자, 트레이딩 또는 기타 유형의 조언이나 권장 사항으로 간주되지 않으며, 트레이딩뷰에서 제공하거나 보증하는 것이 아닙니다. 자세한 내용은 이용 약관을 참조하세요.