
#FTX
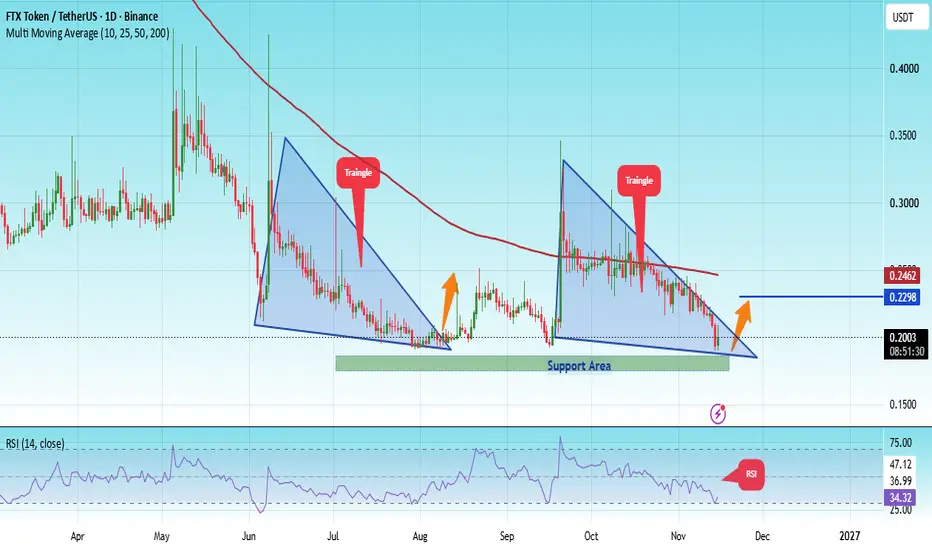
On the daily timeframe, FTT is moving within a well-defined triangle pattern, reflecting a period of price consolidation ahead of a potential directional breakout.
Back in August, the token experienced a strong bullish rally following a successful breakout above the triangle pattern, highlighting the technical significance of this formation in shaping its price movements.
Looking at the current price action, FTT is relying on a major support zone highlighted in green around $0.1750. This level has demonstrated its importance by supporting the price and limiting further selling pressure, potentially serving as a launching point for another bullish rebound.
If the price manages to hold above the current support zone and attract sufficient buying pressure, a new upward move could develop, targeting $0.2300.
This represents an important technical target, particularly as it is located near the resistance level of the 200-day Moving Average (MA200), making it a key area to watch.
The $0.1750 level remains the critical support for this setup. A decisive break below this level, followed by a close beneath it, could invalidate the bullish scenario and significantly weaken the positive outlook.
Overall, FTT is approaching an important technical turning point, with the $0.1750 support zone playing a crucial role in determining its next move. Holding this level could pave the way for a bullish rebound toward $0.2300, where the price may encounter resistance from the 200-day Moving Average.
On the daily timeframe, FTT is moving within a well-defined triangle pattern, reflecting a period of price consolidation ahead of a potential directional breakout.
Back in August, the token experienced a strong bullish rally following a successful breakout above the triangle pattern, highlighting the technical significance of this formation in shaping its price movements.
Looking at the current price action, FTT is relying on a major support zone highlighted in green around $0.1750. This level has demonstrated its importance by supporting the price and limiting further selling pressure, potentially serving as a launching point for another bullish rebound.
If the price manages to hold above the current support zone and attract sufficient buying pressure, a new upward move could develop, targeting $0.2300.
This represents an important technical target, particularly as it is located near the resistance level of the 200-day Moving Average (MA200), making it a key area to watch.
The $0.1750 level remains the critical support for this setup. A decisive break below this level, followed by a close beneath it, could invalidate the bullish scenario and significantly weaken the positive outlook.
Overall, FTT is approaching an important technical turning point, with the $0.1750 support zone playing a crucial role in determining its next move. Holding this level could pave the way for a bullish rebound toward $0.2300, where the price may encounter resistance from the 200-day Moving Average.

Join Telegram Channel Signals Futures and Spot
👉t.me/+WN4RexVn8DM2MTlk
👉t.me/+WN4RexVn8DM2MTlk
면책사항
해당 정보와 게시물은 금융, 투자, 트레이딩 또는 기타 유형의 조언이나 권장 사항으로 간주되지 않으며, 트레이딩뷰에서 제공하거나 보증하는 것이 아닙니다. 자세한 내용은 이용 약관을 참조하세요.
Join Telegram Channel Signals Futures and Spot
👉t.me/+WN4RexVn8DM2MTlk
👉t.me/+WN4RexVn8DM2MTlk
면책사항
해당 정보와 게시물은 금융, 투자, 트레이딩 또는 기타 유형의 조언이나 권장 사항으로 간주되지 않으며, 트레이딩뷰에서 제공하거나 보증하는 것이 아닙니다. 자세한 내용은 이용 약관을 참조하세요.