
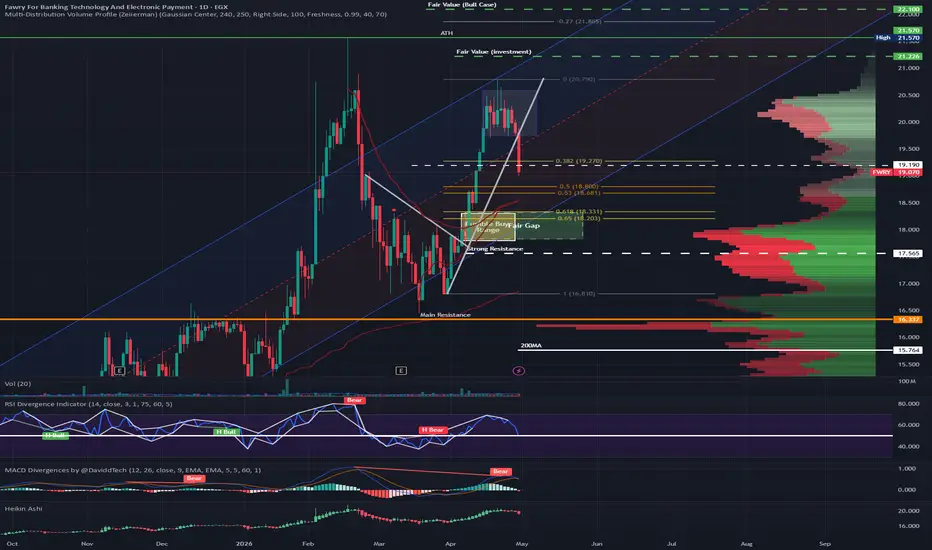
📈 FWRY Technical Analysis: Tracking the Correction
I am closely monitoring FWRY following its recent price action.
Here is the current technical outlook:
Resistance & Consolidation: After hitting the upper limit of its long-term uptrend on Feb 25, the stock entered a two-week consolidation phase and is now showing signs of softness.
Structural Breaks: We’ve seen the price break below several key technical markers, including the rising trend line, the consolidation channel, the 0.382 Fibonacci level, and the 19.2 resistance zone. 📉
The Pullback Target: If this move is a standard pullback, the stock could decline toward 18.3. This level represents the lower band of the uptrend channel, which may provide the necessary momentum for a retest of all-time highs. 🛡️
My Take: I view any pullback in FWRY as a prime opportunity to increase your position rather than a reason to panic or exit the stock. 🧘♂️🎯
If you like my posts, please follow and boost 🙌
🎁 Get a $15 discount on your next subscription:
🔗 tradingview.com/pricing/?share_your_love=mnmabroukw36ix ✨💸

면책사항
해당 정보와 게시물은 금융, 투자, 트레이딩 또는 기타 유형의 조언이나 권장 사항으로 간주되지 않으며, 트레이딩뷰에서 제공하거나 보증하는 것이 아닙니다. 자세한 내용은 이용 약관을 참조하세요.
면책사항
해당 정보와 게시물은 금융, 투자, 트레이딩 또는 기타 유형의 조언이나 권장 사항으로 간주되지 않으며, 트레이딩뷰에서 제공하거나 보증하는 것이 아닙니다. 자세한 내용은 이용 약관을 참조하세요.