롱
Frax Share (FXS) Explosive Growth
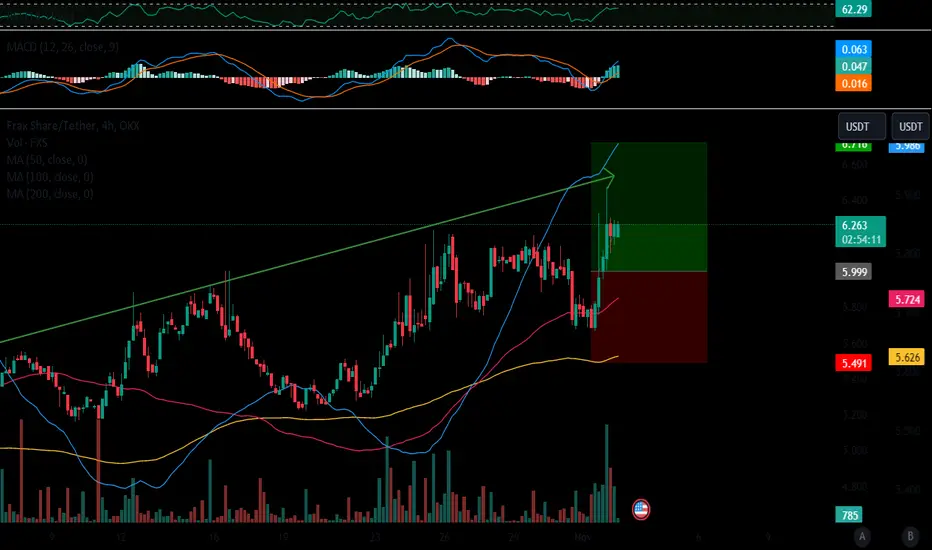
Frax Share (FXS)
FXS hasn't mirrored BTC’s explosive growth just yet. However, the Frax Share chart is currently on an upward trend, and the asset is experiencing steady growth, marked by occasional corrections and pullbacks.
Today, FXS reached a new local high at $6.43. The asset’s main objective is to maintain its upward momentum. The upcoming resistance levels for buyers are positioned at $6.65 and the psychological threshold of $7. If BTC continues to trade within a narrow range, FXS could potentially break through these levels in the foreseeable future.
A correction in line with the primary trend is also a possibility. Buyer orders are stacked within the support zone of $5.65-$5.84, as well as at the $5.46 and $5.21 levels. These zones could be appealing entry points for buyers.

면책사항
해당 정보와 게시물은 금융, 투자, 트레이딩 또는 기타 유형의 조언이나 권장 사항으로 간주되지 않으며, 트레이딩뷰에서 제공하거나 보증하는 것이 아닙니다. 자세한 내용은 이용 약관을 참조하세요.
면책사항
해당 정보와 게시물은 금융, 투자, 트레이딩 또는 기타 유형의 조언이나 권장 사항으로 간주되지 않으며, 트레이딩뷰에서 제공하거나 보증하는 것이 아닙니다. 자세한 내용은 이용 약관을 참조하세요.