
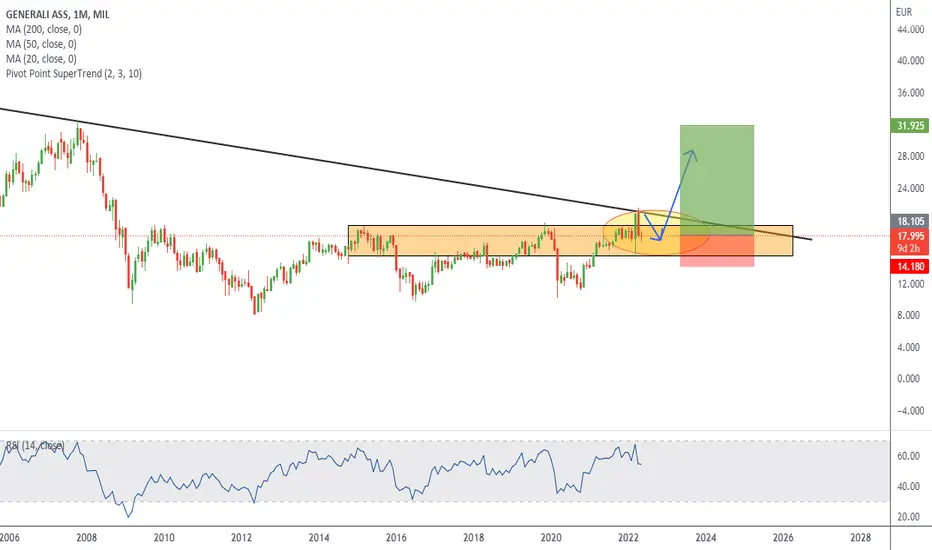
For having a better understading of what is happening on this stock about my last idea, on the Montly chart we see a clear break of structure and a retest of it after testing an important trendline(formed in Oct 07).The price has been bouncing over the last 12 years and now finally we see a strong candle formed in March this year breaking all structure and showing us bullish pressure. We can expect more bullish continuation the next months if price manage to break this trendline. Important monitoring price action in lower timeframes.

면책사항
해당 정보와 게시물은 금융, 투자, 트레이딩 또는 기타 유형의 조언이나 권장 사항으로 간주되지 않으며, 트레이딩뷰에서 제공하거나 보증하는 것이 아닙니다. 자세한 내용은 이용 약관을 참조하세요.
면책사항
해당 정보와 게시물은 금융, 투자, 트레이딩 또는 기타 유형의 조언이나 권장 사항으로 간주되지 않으며, 트레이딩뷰에서 제공하거나 보증하는 것이 아닙니다. 자세한 내용은 이용 약관을 참조하세요.