
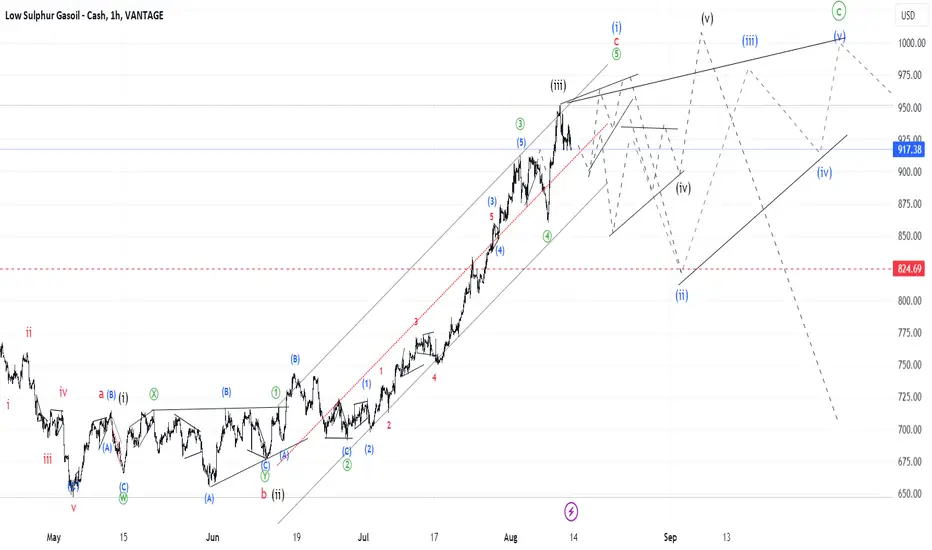
The Gasoil chart also has several alternatives to how it can shape the end of the uptrend. I indicated them on the chart below. Black labels mark the alternative scenario. Probability is not much different from each other. In summary, we have to prepare for a volatile environment which would be difficult to orientate until it is over and wave [c] of X is formed.

면책사항
해당 정보와 게시물은 금융, 투자, 트레이딩 또는 기타 유형의 조언이나 권장 사항으로 간주되지 않으며, 트레이딩뷰에서 제공하거나 보증하는 것이 아닙니다. 자세한 내용은 이용 약관을 참조하세요.
면책사항
해당 정보와 게시물은 금융, 투자, 트레이딩 또는 기타 유형의 조언이나 권장 사항으로 간주되지 않으며, 트레이딩뷰에서 제공하거나 보증하는 것이 아닙니다. 자세한 내용은 이용 약관을 참조하세요.