

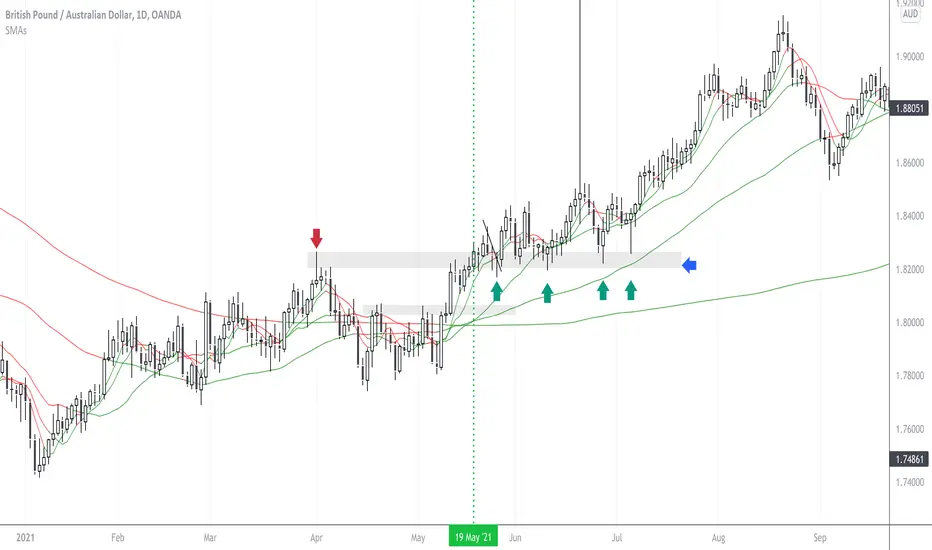
We start by creating a visual for when all moving averages are in order and across the 200 moving average. In this example, I have used a vertical line in the colour of our bias direction, Long(Green), when this condition has been met. We now have an increased confidence by filtering out trade setups that do not meet our bias giving a higher probability and focus.
Levels of previous resistance give us a price that we can enter the market by turning into a new level of support. In this example I have highlighted this with a red arrow located on the left hand side.
Now we have a trading bias and a methodology to set price restrictions to enter the market, we can now trade only long positions and trade setups. In this example I have highlighted long opportunities that have been triggered with arrows in green located on the right hand side. Entry points can be executed on either the daily, 4hour or 1hour charts depending on risk and trading style preference. Please note - Lower time frames may generate more signals which presents more risk.
Levels of previous resistance give us a price that we can enter the market by turning into a new level of support. In this example I have highlighted this with a red arrow located on the left hand side.
Now we have a trading bias and a methodology to set price restrictions to enter the market, we can now trade only long positions and trade setups. In this example I have highlighted long opportunities that have been triggered with arrows in green located on the right hand side. Entry points can be executed on either the daily, 4hour or 1hour charts depending on risk and trading style preference. Please note - Lower time frames may generate more signals which presents more risk.

면책사항
해당 정보와 게시물은 금융, 투자, 트레이딩 또는 기타 유형의 조언이나 권장 사항으로 간주되지 않으며, 트레이딩뷰에서 제공하거나 보증하는 것이 아닙니다. 자세한 내용은 이용 약관을 참조하세요.
면책사항
해당 정보와 게시물은 금융, 투자, 트레이딩 또는 기타 유형의 조언이나 권장 사항으로 간주되지 않으며, 트레이딩뷰에서 제공하거나 보증하는 것이 아닙니다. 자세한 내용은 이용 약관을 참조하세요.