

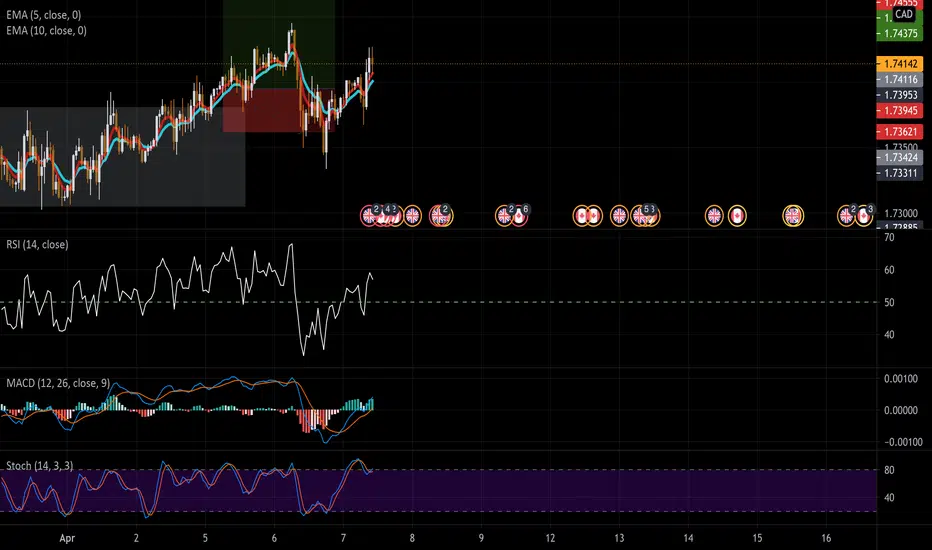
On this strategy,
1 Step. First thing, need to find healthy up or down trend, Any sidewise trend place a rectangle shape of 8pips height.
2 Step: Indicator used on main panel are mcginley 8 and 14. So After avoiding Sidewise Trend. Wait for these two line crossover.
3 Step: RSI indicator need to be set at 50 and remove lower band of RSI. So if the RSI is Just above the 50% line then buy signal and if below 50% then sell. ( Just need to point up or down near 50% line)
4 Step: Setup MACD Indicator. Use with histogram. Default setting. ( For Buy two line must point upward with Bullish Histogram and reversal for sell)
5 Step: Stoch indicator. Again default setting with higher and lower band. If indicator pointing upward then buy confirmation and reverse for sell.
6 Step: SL need to be Just above the mcginley Line crossover. RR 1:2.5 or 1:3RR Minimum otherwise no trade
Any Suggestion welcome
Gautam

면책사항
해당 정보와 게시물은 금융, 투자, 트레이딩 또는 기타 유형의 조언이나 권장 사항으로 간주되지 않으며, 트레이딩뷰에서 제공하거나 보증하는 것이 아닙니다. 자세한 내용은 이용 약관을 참조하세요.
면책사항
해당 정보와 게시물은 금융, 투자, 트레이딩 또는 기타 유형의 조언이나 권장 사항으로 간주되지 않으며, 트레이딩뷰에서 제공하거나 보증하는 것이 아닙니다. 자세한 내용은 이용 약관을 참조하세요.