

Hey guys,
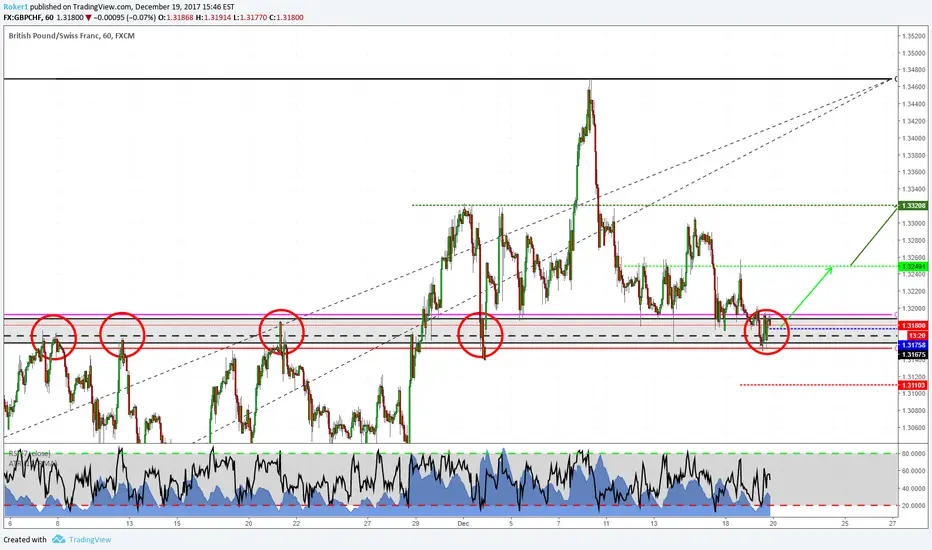
this is an hourly chart of GBPCHF and i'm taking this long trade because price is founding some support in a key daily structure and that meets my rules of engagement since we have a nice double bottom (you can see it by zooming in or going on even lower timeframes) and a nice engulfing candle on the 4H timeframe. Bigger picture is always important to determine which direction you want to take, so start your daily analysis by looking at higher timeframes to give you perspective on the market conditions! I think you'll reap the benefits as soon as you get used to that.
If you have ideas/questions, feel free to comment below.
Otherwise, see you in the next chart!
this is an hourly chart of GBPCHF and i'm taking this long trade because price is founding some support in a key daily structure and that meets my rules of engagement since we have a nice double bottom (you can see it by zooming in or going on even lower timeframes) and a nice engulfing candle on the 4H timeframe. Bigger picture is always important to determine which direction you want to take, so start your daily analysis by looking at higher timeframes to give you perspective on the market conditions! I think you'll reap the benefits as soon as you get used to that.
If you have ideas/questions, feel free to comment below.
Otherwise, see you in the next chart!
거래청산: 타겟 닿음
First target hit! Stops to breakeven!
면책사항
해당 정보와 게시물은 금융, 투자, 트레이딩 또는 기타 유형의 조언이나 권장 사항으로 간주되지 않으며, 트레이딩뷰에서 제공하거나 보증하는 것이 아닙니다. 자세한 내용은 이용 약관을 참조하세요.
면책사항
해당 정보와 게시물은 금융, 투자, 트레이딩 또는 기타 유형의 조언이나 권장 사항으로 간주되지 않으며, 트레이딩뷰에서 제공하거나 보증하는 것이 아닙니다. 자세한 내용은 이용 약관을 참조하세요.