

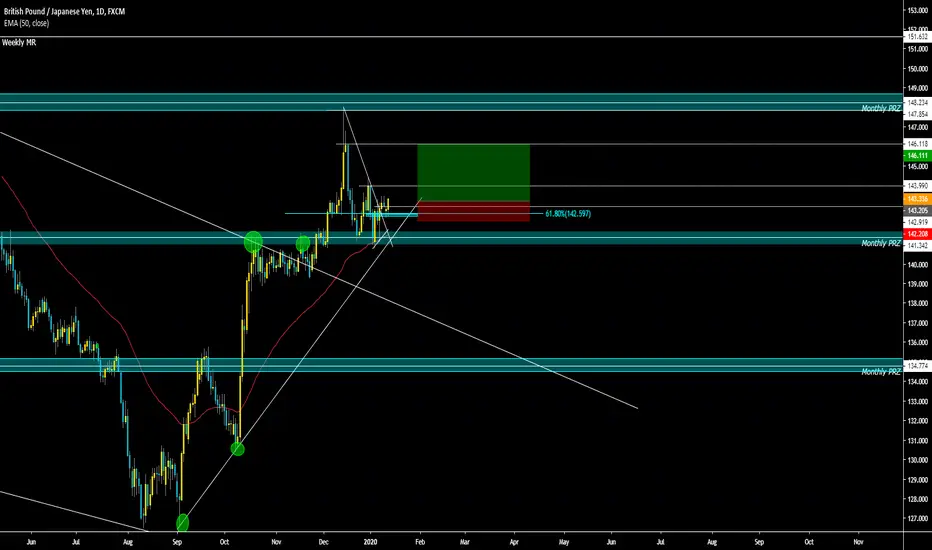
Daily timeframe is giving us signs of a possible new bullish momentum where right nice we can see how price failed to break right below the previous bearish structure that lines up with the monthly PRZ,EMA,ascendign daily TL and daily support going back to the 143.00 area after 4 tries to break below it so if daily close above the mentioned level and keep holdin above the 61% fib we might see a push atleast to the 146.00 area

면책사항
해당 정보와 게시물은 금융, 투자, 트레이딩 또는 기타 유형의 조언이나 권장 사항으로 간주되지 않으며, 트레이딩뷰에서 제공하거나 보증하는 것이 아닙니다. 자세한 내용은 이용 약관을 참조하세요.
면책사항
해당 정보와 게시물은 금융, 투자, 트레이딩 또는 기타 유형의 조언이나 권장 사항으로 간주되지 않으며, 트레이딩뷰에서 제공하거나 보증하는 것이 아닙니다. 자세한 내용은 이용 약관을 참조하세요.