

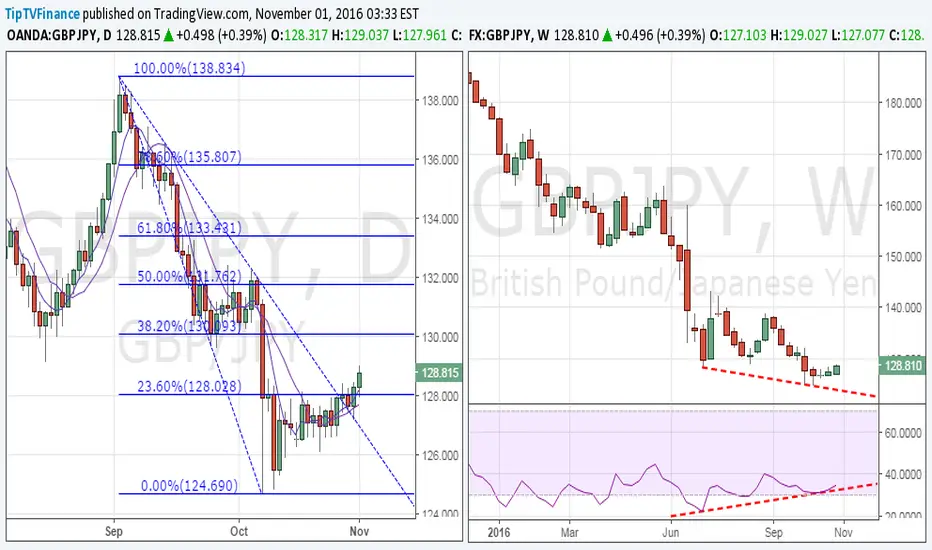
Daily/Weekly chart
· The pair finally closed above 128.03 (23.6% Fibo of Sept high and Oct low) after having repeated failed to do so last month. Also note the bullish 5-DMA and 10-DMA crossover.
· On the weekly chart, we have a bullish price RSI divergence. Consequently, the cross looks poised for a rise to 130.10 (38.2% Fibo).
· On the other hand, only a daily close below 127.19 (previous day’s low) would signal bullish invalidation.
· The pair finally closed above 128.03 (23.6% Fibo of Sept high and Oct low) after having repeated failed to do so last month. Also note the bullish 5-DMA and 10-DMA crossover.
· On the weekly chart, we have a bullish price RSI divergence. Consequently, the cross looks poised for a rise to 130.10 (38.2% Fibo).
· On the other hand, only a daily close below 127.19 (previous day’s low) would signal bullish invalidation.

면책사항
해당 정보와 게시물은 금융, 투자, 트레이딩 또는 기타 유형의 조언이나 권장 사항으로 간주되지 않으며, 트레이딩뷰에서 제공하거나 보증하는 것이 아닙니다. 자세한 내용은 이용 약관을 참조하세요.
면책사항
해당 정보와 게시물은 금융, 투자, 트레이딩 또는 기타 유형의 조언이나 권장 사항으로 간주되지 않으며, 트레이딩뷰에서 제공하거나 보증하는 것이 아닙니다. 자세한 내용은 이용 약관을 참조하세요.