

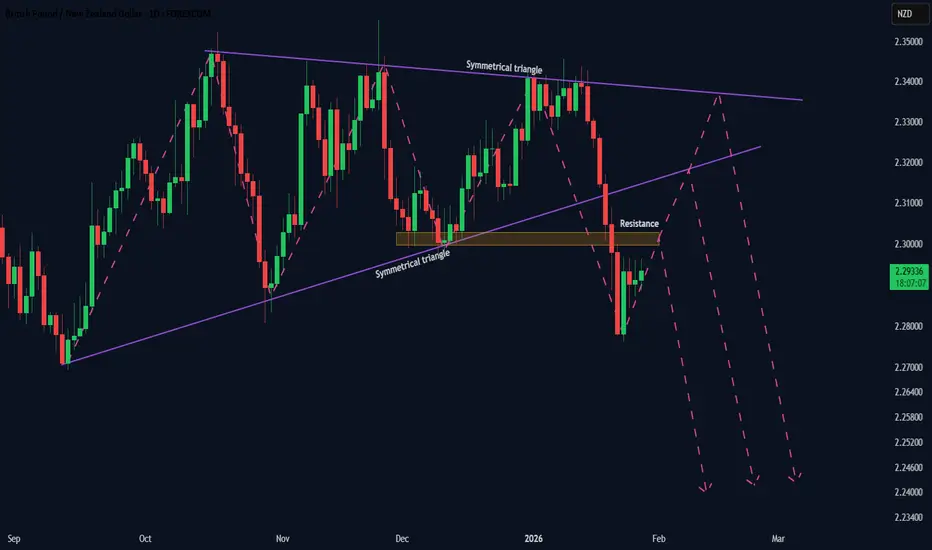
Price previously developed inside a clear symmetrical triangle on the Daily chart, representing a prolonged phase of balance between buyers and sellers.
That balance was resolved to the downside with a decisive breakdown, signaling that selling pressure has taken control.
Price is now in a pullback phase, which is a natural behavior after a strong directional expansion.
This is not a prediction — it is an observation of how market pressure interacts with structure after imbalance.
📉 Scenario Observations – Pullback Within Bearish Pressure
Possible pullback paths while bearish pressure remains dominant:
• pullback into prior resistance, then continuation lower
• pullback toward the ascending trendline, followed by rejection
• deeper pullback toward the descending triangle trendline, then continuation lower
All three scenarios reflect corrective movement within a bearish pressure environment.
⚠️ Pressure Reassessment
If price breaks and sustains above the descending trendline, bearish pressure becomes less evident and the structure requires reassessment.
🧠 Key Insight
Markets move from balance → imbalance → correction.
Pressure, not patterns, determines continuation.
⚠️ Educational & Analytical Use Only
This analysis is shared strictly for educational and analytical purposes.
No financial advice, trade signals, or guarantees are provided.
All decisions remain the sole responsibility of the reader and should align with their own ethical, legal, and religious principles.
That balance was resolved to the downside with a decisive breakdown, signaling that selling pressure has taken control.
Price is now in a pullback phase, which is a natural behavior after a strong directional expansion.
This is not a prediction — it is an observation of how market pressure interacts with structure after imbalance.
📉 Scenario Observations – Pullback Within Bearish Pressure
Possible pullback paths while bearish pressure remains dominant:
• pullback into prior resistance, then continuation lower
• pullback toward the ascending trendline, followed by rejection
• deeper pullback toward the descending triangle trendline, then continuation lower
All three scenarios reflect corrective movement within a bearish pressure environment.
⚠️ Pressure Reassessment
If price breaks and sustains above the descending trendline, bearish pressure becomes less evident and the structure requires reassessment.
🧠 Key Insight
Markets move from balance → imbalance → correction.
Pressure, not patterns, determines continuation.
⚠️ Educational & Analytical Use Only
This analysis is shared strictly for educational and analytical purposes.
No financial advice, trade signals, or guarantees are provided.
All decisions remain the sole responsibility of the reader and should align with their own ethical, legal, and religious principles.

관련 발행물
면책사항
해당 정보와 게시물은 금융, 투자, 트레이딩 또는 기타 유형의 조언이나 권장 사항으로 간주되지 않으며, 트레이딩뷰에서 제공하거나 보증하는 것이 아닙니다. 자세한 내용은 이용 약관을 참조하세요.
관련 발행물
면책사항
해당 정보와 게시물은 금융, 투자, 트레이딩 또는 기타 유형의 조언이나 권장 사항으로 간주되지 않으며, 트레이딩뷰에서 제공하거나 보증하는 것이 아닙니다. 자세한 내용은 이용 약관을 참조하세요.