

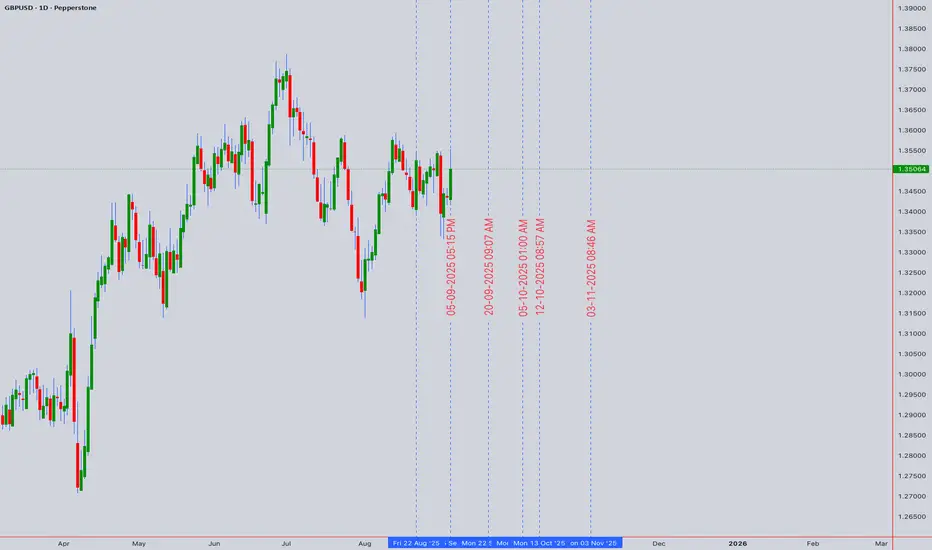
🔮 GBPUSD Technical Forecast & Trading Strategy | Week of Sept 6th, 2025
Current Spot Price: 1.35064 | CFD | Date: Sept 6, 2025
🟢 Overall Bias: CAUTIOUSLY BEARISH | Primary analysis suggests a potential corrective pullback is imminent. However, the broader bullish trend on higher timeframes remains intact until key support breaks.
📊 Multi-Timeframe Technical Breakdown
1. Chart Pattern & Theory Convergence:
⚠️ Potential Head & Shoulders Top (H&S) Formation: On the 4H chart, a developing bearish reversal pattern is visible. The left shoulder, head, and a forming right shoulder suggest a pullback towards the neckline near 1.3420-1.3400 is possible.
📐 Gann Theory & Square of 9: Key Gann resistance was evident near 1.3520-1.3530. The current rejection from this zone adds credibility to the bearish short-term outlook. The next major Gann support level aligns with the H&S target around 1.3400.
🌊 Elliott Wave Theory: Price action from the recent low appears to be completing a 5-wave impulsive move up. We are likely entering a corrective Wave A or B pullback.
🦀 Harmonic Patterns: The rally has approached a potential Bearish Crab or Bat pattern completion zone, where PRZs (Potential Reversal Zones) often coincide with Fibonacci extensions (e.g., 1.618). This reinforces the resistance area.
2. Key Indicator Signals:
📶 RSI (14): On the 4H chart, the RSI is showing a clear bearish divergence 📉. Price made a higher high, but the RSI made a lower high. This is a classic warning sign of weakening bullish momentum.
📏 Bollinger Bands (20,2): Price has kissed the upper band and is pulling back towards the middle band (20 SMA ~1.3460), which will act as immediate support. A break below could target the lower band.
⚖️ VWAP & Anchored VWAP: The price is trading above the daily VWAP, indicating the average buyer is still in profit. However, a break below a key Anchored VWAP (from the last significant low) would signal a shift in medium-term momentum.
📈 Moving Averages: The 50 and 200 EMA's on the 4H are still bullishly aligned, providing dynamic support. A break below the 50 EMA (~1.3470) would be the first sign of bearish acceleration.
3. Critical Support & Resistance:
🎯 Immediate Resistance: 1.3520 - 1.3535 (Gann Level, Previous High)
🎯 Key Resistance: 1.3600 - 1.3650 (Psychological, Swing High)
🛡️ Immediate Support: 1.3470 (50 EMA)
🛡️ Strong Support: 1.3420 - 1.3400 (H&S Neckline, Psychological)
🛡️ Major Support: 1.3350 (200 EMA, Wave 4 base)
⚡ Trading Strategies & Setups
A. Intraday Trading (5M - 1H Charts):
Strategy: Look for short opportunities on any retest of the 1.3520 resistance area, especially if confirmed by a bearish candlestick pattern (e.g., Bearish Engulfing, Shooting Star) and RSI rejection from overbought (>70) territory.
Short Entry (Ideal): ~1.3515 | Stop Loss: 1.3545 | Take Profit 1: 1.3480 | Take Profit 2: 1.3440
Scalp Long: Only on a bounce from the 1.3470 (50 EMA) support with a tight stop.
B. Swing Trading (4H - D Charts):
Strategy: The confluence of the H&S pattern, RSI divergence, and Gann resistance provides a high-probability swing short setup.
Swing Short Entry: On a break below the 1.3470 support or a rejection from 1.3520. | Stop Loss: Above 1.3550 | Target 1: 1.3420 (Neckline) | Target 2: 1.3350
Bullish Invalidation: A decisive break and close above 1.3550 would invalidate the immediate bearish setup and open a path to 1.3650.
🌍 Market Context & Risk Factors
Geopolitical & Political Events: Monitor any developments related to UK-EU relations, BoE and Fed policy divergence, and global risk sentiment. Volatility is guaranteed around high-impact news events.
USD Strength: The forecast is partially contingent on a broader USD recovery. Watch the DXY (Dollar Index) for confirmation.
✅ Key Takeaways:
Confluence is Key! Multiple independent theories (Gann, Elliott, Harmonics) are pointing to a resistance zone.
Momentum is Waning. The RSI divergence is a critical red flag for bulls 🚩.
Respect the Levels. Trade the break of 1.3470 (support) or 1.3550 (resistance).
Manage Risk. Always use stop-loss orders. The market can remain irrational longer than you can remain solvent.
For individuals seeking to enhance their trading abilities based on the analyses provided, I recommend exploring the mentoring program offered by Shunya Trade. (Website: shunya dot trade)
I would appreciate your feedback on this analysis, as it will serve as a valuable resource for future endeavors.
Sincerely,
Shunya.Trade
Website: shunya dot trade
⚠️Disclaimer: This post is intended solely for educational purposes and does not constitute investment advice, financial advice, or trading recommendations. The views expressed herein are derived from technical analysis and are shared for informational purposes only. The stock market inherently carries risks, including the potential for capital loss. Therefore, readers are strongly advised to exercise prudent judgment before making any investment decisions. We assume no liability for any actions taken based on this content. For personalized guidance, it is recommended to consult a certified financial advisor.
Current Spot Price: 1.35064 | CFD | Date: Sept 6, 2025
🟢 Overall Bias: CAUTIOUSLY BEARISH | Primary analysis suggests a potential corrective pullback is imminent. However, the broader bullish trend on higher timeframes remains intact until key support breaks.
📊 Multi-Timeframe Technical Breakdown
1. Chart Pattern & Theory Convergence:
⚠️ Potential Head & Shoulders Top (H&S) Formation: On the 4H chart, a developing bearish reversal pattern is visible. The left shoulder, head, and a forming right shoulder suggest a pullback towards the neckline near 1.3420-1.3400 is possible.
📐 Gann Theory & Square of 9: Key Gann resistance was evident near 1.3520-1.3530. The current rejection from this zone adds credibility to the bearish short-term outlook. The next major Gann support level aligns with the H&S target around 1.3400.
🌊 Elliott Wave Theory: Price action from the recent low appears to be completing a 5-wave impulsive move up. We are likely entering a corrective Wave A or B pullback.
🦀 Harmonic Patterns: The rally has approached a potential Bearish Crab or Bat pattern completion zone, where PRZs (Potential Reversal Zones) often coincide with Fibonacci extensions (e.g., 1.618). This reinforces the resistance area.
2. Key Indicator Signals:
📶 RSI (14): On the 4H chart, the RSI is showing a clear bearish divergence 📉. Price made a higher high, but the RSI made a lower high. This is a classic warning sign of weakening bullish momentum.
📏 Bollinger Bands (20,2): Price has kissed the upper band and is pulling back towards the middle band (20 SMA ~1.3460), which will act as immediate support. A break below could target the lower band.
⚖️ VWAP & Anchored VWAP: The price is trading above the daily VWAP, indicating the average buyer is still in profit. However, a break below a key Anchored VWAP (from the last significant low) would signal a shift in medium-term momentum.
📈 Moving Averages: The 50 and 200 EMA's on the 4H are still bullishly aligned, providing dynamic support. A break below the 50 EMA (~1.3470) would be the first sign of bearish acceleration.
3. Critical Support & Resistance:
🎯 Immediate Resistance: 1.3520 - 1.3535 (Gann Level, Previous High)
🎯 Key Resistance: 1.3600 - 1.3650 (Psychological, Swing High)
🛡️ Immediate Support: 1.3470 (50 EMA)
🛡️ Strong Support: 1.3420 - 1.3400 (H&S Neckline, Psychological)
🛡️ Major Support: 1.3350 (200 EMA, Wave 4 base)
⚡ Trading Strategies & Setups
A. Intraday Trading (5M - 1H Charts):
Strategy: Look for short opportunities on any retest of the 1.3520 resistance area, especially if confirmed by a bearish candlestick pattern (e.g., Bearish Engulfing, Shooting Star) and RSI rejection from overbought (>70) territory.
Short Entry (Ideal): ~1.3515 | Stop Loss: 1.3545 | Take Profit 1: 1.3480 | Take Profit 2: 1.3440
Scalp Long: Only on a bounce from the 1.3470 (50 EMA) support with a tight stop.
B. Swing Trading (4H - D Charts):
Strategy: The confluence of the H&S pattern, RSI divergence, and Gann resistance provides a high-probability swing short setup.
Swing Short Entry: On a break below the 1.3470 support or a rejection from 1.3520. | Stop Loss: Above 1.3550 | Target 1: 1.3420 (Neckline) | Target 2: 1.3350
Bullish Invalidation: A decisive break and close above 1.3550 would invalidate the immediate bearish setup and open a path to 1.3650.
🌍 Market Context & Risk Factors
Geopolitical & Political Events: Monitor any developments related to UK-EU relations, BoE and Fed policy divergence, and global risk sentiment. Volatility is guaranteed around high-impact news events.
USD Strength: The forecast is partially contingent on a broader USD recovery. Watch the DXY (Dollar Index) for confirmation.
✅ Key Takeaways:
Confluence is Key! Multiple independent theories (Gann, Elliott, Harmonics) are pointing to a resistance zone.
Momentum is Waning. The RSI divergence is a critical red flag for bulls 🚩.
Respect the Levels. Trade the break of 1.3470 (support) or 1.3550 (resistance).
Manage Risk. Always use stop-loss orders. The market can remain irrational longer than you can remain solvent.
For individuals seeking to enhance their trading abilities based on the analyses provided, I recommend exploring the mentoring program offered by Shunya Trade. (Website: shunya dot trade)
I would appreciate your feedback on this analysis, as it will serve as a valuable resource for future endeavors.
Sincerely,
Shunya.Trade
Website: shunya dot trade
⚠️Disclaimer: This post is intended solely for educational purposes and does not constitute investment advice, financial advice, or trading recommendations. The views expressed herein are derived from technical analysis and are shared for informational purposes only. The stock market inherently carries risks, including the potential for capital loss. Therefore, readers are strongly advised to exercise prudent judgment before making any investment decisions. We assume no liability for any actions taken based on this content. For personalized guidance, it is recommended to consult a certified financial advisor.

I am nothing @shunya.trade
면책사항
해당 정보와 게시물은 금융, 투자, 트레이딩 또는 기타 유형의 조언이나 권장 사항으로 간주되지 않으며, 트레이딩뷰에서 제공하거나 보증하는 것이 아닙니다. 자세한 내용은 이용 약관을 참조하세요.
I am nothing @shunya.trade
면책사항
해당 정보와 게시물은 금융, 투자, 트레이딩 또는 기타 유형의 조언이나 권장 사항으로 간주되지 않으며, 트레이딩뷰에서 제공하거나 보증하는 것이 아닙니다. 자세한 내용은 이용 약관을 참조하세요.