

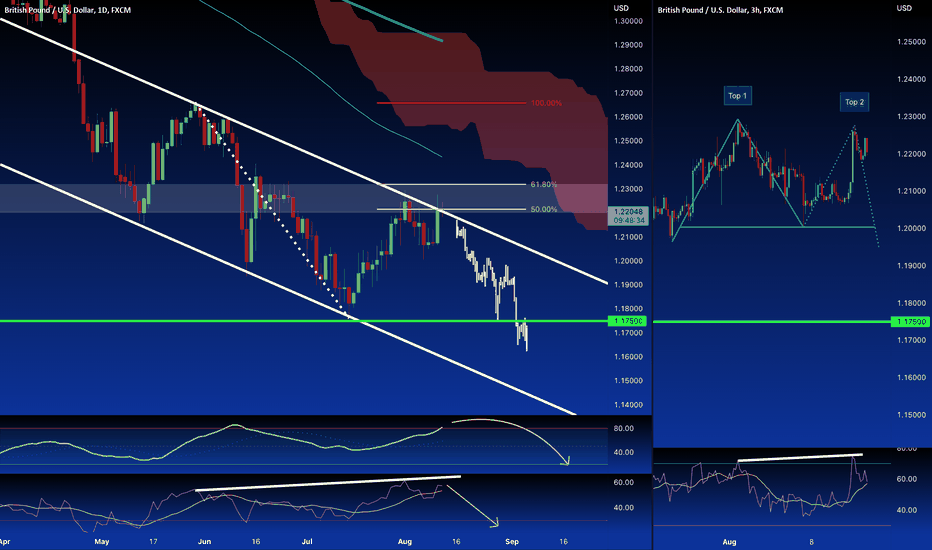
As explained yesterday
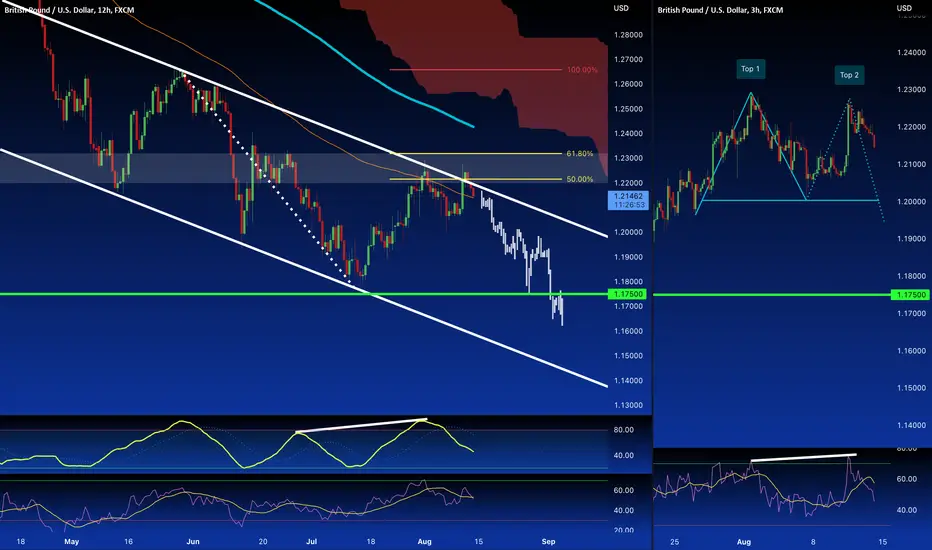
the price after the CPI release news had in a first moment Big Bullish candle, absorbed and then the retested again the Dynamic resistance given from the Bearish channel inside the 50 / 61.8% Fibo levels and Resistance area ( White rectangle ) before definitely dropdown. The Stochastic it's a comeback in the range area after the Overbought area, ( note the Divergence ) meanwhile, the RSI Turned Bearish today in the H12 timeframe.
In the lower timeframe, on the Right of the chart, we can see a Double Top formation with divergence and Overbought by the RSI.
Yesterday we show this opportunity and today the price dropped down following our Idea of the forecast.
the price after the CPI release news had in a first moment Big Bullish candle, absorbed and then the retested again the Dynamic resistance given from the Bearish channel inside the 50 / 61.8% Fibo levels and Resistance area ( White rectangle ) before definitely dropdown. The Stochastic it's a comeback in the range area after the Overbought area, ( note the Divergence ) meanwhile, the RSI Turned Bearish today in the H12 timeframe.
In the lower timeframe, on the Right of the chart, we can see a Double Top formation with divergence and Overbought by the RSI.
Yesterday we show this opportunity and today the price dropped down following our Idea of the forecast.

관련 발행물
면책사항
해당 정보와 게시물은 금융, 투자, 트레이딩 또는 기타 유형의 조언이나 권장 사항으로 간주되지 않으며, 트레이딩뷰에서 제공하거나 보증하는 것이 아닙니다. 자세한 내용은 이용 약관을 참조하세요.
관련 발행물
면책사항
해당 정보와 게시물은 금융, 투자, 트레이딩 또는 기타 유형의 조언이나 권장 사항으로 간주되지 않으며, 트레이딩뷰에서 제공하거나 보증하는 것이 아닙니다. 자세한 내용은 이용 약관을 참조하세요.