

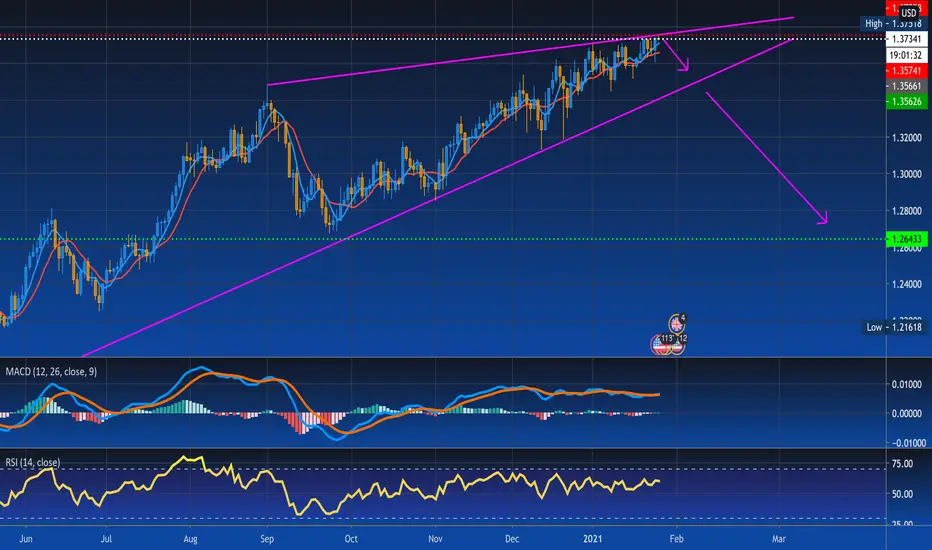
- The daily chart looks to have been forming an Ascending/Rising Wedge.
- Since the beginning of December 2020 price has been on the rise with RSI steady above 50, but remaining under the overbought threshold of 70.
- MACD has also been quite flat as well since December 2020.
Scenarios:
1) Upside breakout, if upper trend line is broken we could see upside and revisit the April 2018 high of 1.4376.
2) Downside breakout, if lower trend line is broken we could see downside to the 1.2643 Support.
My Guess:
Traditionally ascending wedges are seen to have a bearish bias so I am leaning more towards the downside breakout. We shall wait and see.
노트
We've seen some downward movement over the past few days bringing us closer to the lower trend line. The USD is still very strong at the moment.Current Bearish setup on the Daily chart as of 2/4/2021 at 1:40pm EST
- 5 MA is below 10 MA
- MACD, Fast is below the Signal line and trending down toward 0 line
- RSI is 53 (looking for a drop below the 50 line)

면책사항
해당 정보와 게시물은 금융, 투자, 트레이딩 또는 기타 유형의 조언이나 권장 사항으로 간주되지 않으며, 트레이딩뷰에서 제공하거나 보증하는 것이 아닙니다. 자세한 내용은 이용 약관을 참조하세요.
면책사항
해당 정보와 게시물은 금융, 투자, 트레이딩 또는 기타 유형의 조언이나 권장 사항으로 간주되지 않으며, 트레이딩뷰에서 제공하거나 보증하는 것이 아닙니다. 자세한 내용은 이용 약관을 참조하세요.