

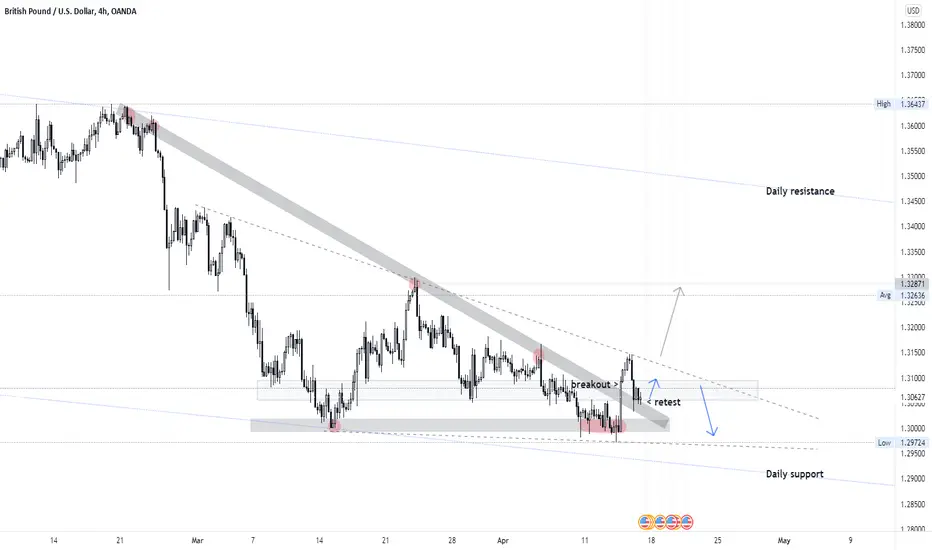
This is the technical analysis of GBPUSD H4. Based on chart pattern analysis. We can find a triangle and wedge pattern,
The direction of the trend is sideways tends to be bearish, there are economic data to be released, prices will fluctuate. we can take this opportunity to take a buy low - sell high :
1. The price is still moving in the pattern area.
2. Moderate buy action is possible, the price has retesting triangle area.
Risk : The UK economy does not seem to be in good shape relative to the U.S. with consumer confidence on the decline, rampant inflation and the end of free COVID-19 testing could add to negative data prints to come. A weaker than expected figure could add to bearish bets on the cable pairing.
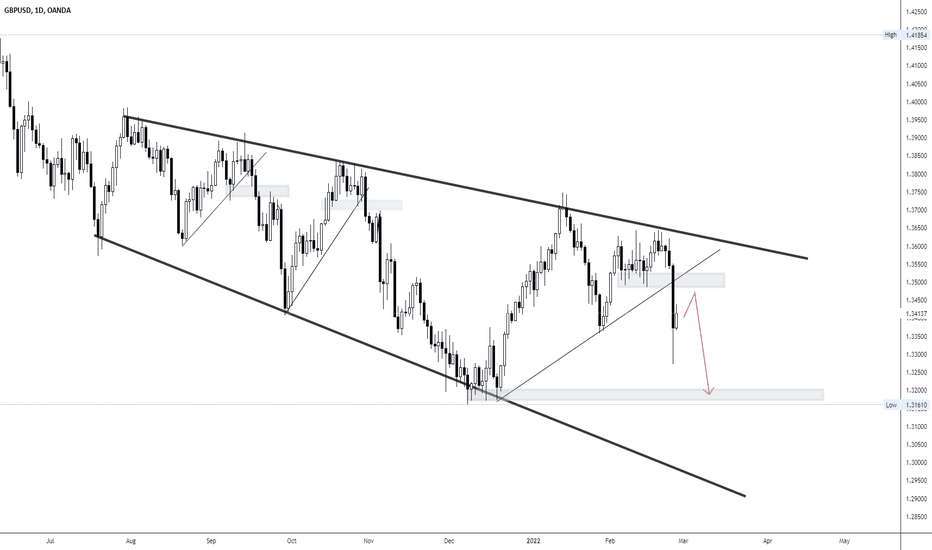
The direction of the trend is sideways tends to be bearish, there are economic data to be released, prices will fluctuate. we can take this opportunity to take a buy low - sell high :
1. The price is still moving in the pattern area.
2. Moderate buy action is possible, the price has retesting triangle area.
Risk : The UK economy does not seem to be in good shape relative to the U.S. with consumer confidence on the decline, rampant inflation and the end of free COVID-19 testing could add to negative data prints to come. A weaker than expected figure could add to bearish bets on the cable pairing.

관련 발행물
면책사항
해당 정보와 게시물은 금융, 투자, 트레이딩 또는 기타 유형의 조언이나 권장 사항으로 간주되지 않으며, 트레이딩뷰에서 제공하거나 보증하는 것이 아닙니다. 자세한 내용은 이용 약관을 참조하세요.
면책사항
해당 정보와 게시물은 금융, 투자, 트레이딩 또는 기타 유형의 조언이나 권장 사항으로 간주되지 않으며, 트레이딩뷰에서 제공하거나 보증하는 것이 아닙니다. 자세한 내용은 이용 약관을 참조하세요.