
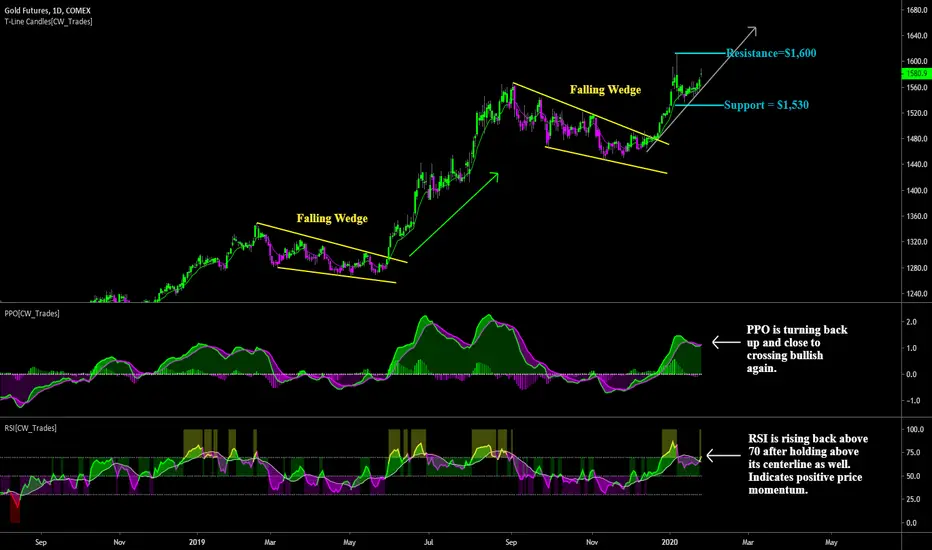
While equities have been putting in a series of bearish rising wedges, gold has two successful falling wedge breakouts on the daily chart and is looking good for a move above short-term resistance at $1,600. Price indicators are both showing a bullish trend and momentum behind price with a new advance likely coming this week. Main thing we want to see on any potential pullback is a hold above the gray arrow which represents the current support level of the uptrend. Secondary support is $1,500, price remaining above that level and bouncing again would be considered a bullish retest; a break below $1,500 would give reason for shorting.

면책사항
해당 정보와 게시물은 금융, 투자, 트레이딩 또는 기타 유형의 조언이나 권장 사항으로 간주되지 않으며, 트레이딩뷰에서 제공하거나 보증하는 것이 아닙니다. 자세한 내용은 이용 약관을 참조하세요.
면책사항
해당 정보와 게시물은 금융, 투자, 트레이딩 또는 기타 유형의 조언이나 권장 사항으로 간주되지 않으며, 트레이딩뷰에서 제공하거나 보증하는 것이 아닙니다. 자세한 내용은 이용 약관을 참조하세요.