
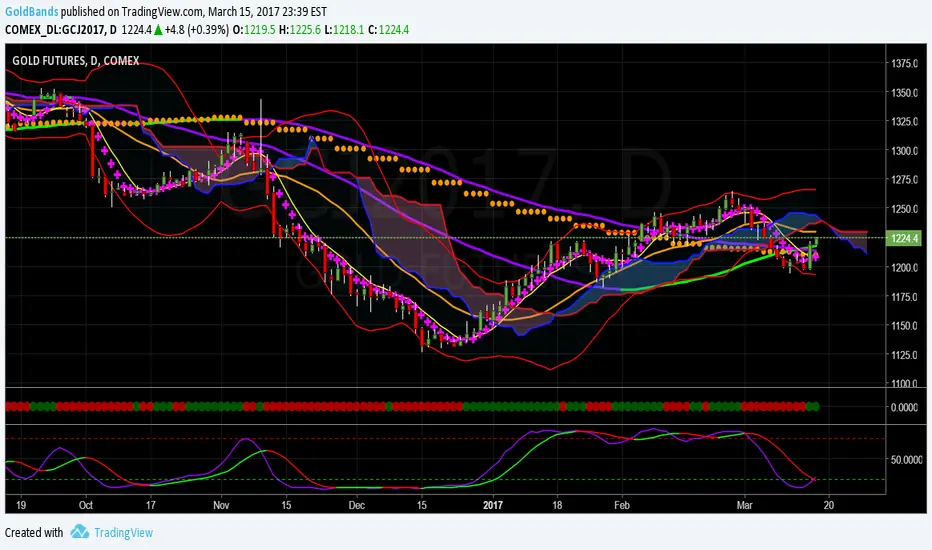
The Fed today announced an increase in the Fed rate. This was not a surprise. What was surprising is the Gold rally that followed. In fact, Gold blasted through all resistance levels, including the 6 and 8 day moving averages, the 50 day moving average and the 21 weekly moving average.
The Heikin-Ashi chart also shows a dramatic change of direction (see below)

Now the question is where is Gold going. First, when price breaks the 6 day moving average, statistically speaking, there is a high probability will price will hit the 21 day moving average. Right now, that's at ~1230. My next target would be the top Bollinger Band. That's currently at 1265. This is what I call a coast to coast trade. After that, well, we'll evaluate that in the days to come.

The last chart tonight is the Volume Profile chart. Notice that the short and intermediate term POC is at 1230. This will act like a magnet to price and makes another good target.
Disclaimer: This post is for educational purposes only. Trade at your own risk.
The Heikin-Ashi chart also shows a dramatic change of direction (see below)
Now the question is where is Gold going. First, when price breaks the 6 day moving average, statistically speaking, there is a high probability will price will hit the 21 day moving average. Right now, that's at ~1230. My next target would be the top Bollinger Band. That's currently at 1265. This is what I call a coast to coast trade. After that, well, we'll evaluate that in the days to come.
The last chart tonight is the Volume Profile chart. Notice that the short and intermediate term POC is at 1230. This will act like a magnet to price and makes another good target.
Disclaimer: This post is for educational purposes only. Trade at your own risk.

관련 발행물
면책사항
해당 정보와 게시물은 금융, 투자, 트레이딩 또는 기타 유형의 조언이나 권장 사항으로 간주되지 않으며, 트레이딩뷰에서 제공하거나 보증하는 것이 아닙니다. 자세한 내용은 이용 약관을 참조하세요.
면책사항
해당 정보와 게시물은 금융, 투자, 트레이딩 또는 기타 유형의 조언이나 권장 사항으로 간주되지 않으며, 트레이딩뷰에서 제공하거나 보증하는 것이 아닙니다. 자세한 내용은 이용 약관을 참조하세요.