
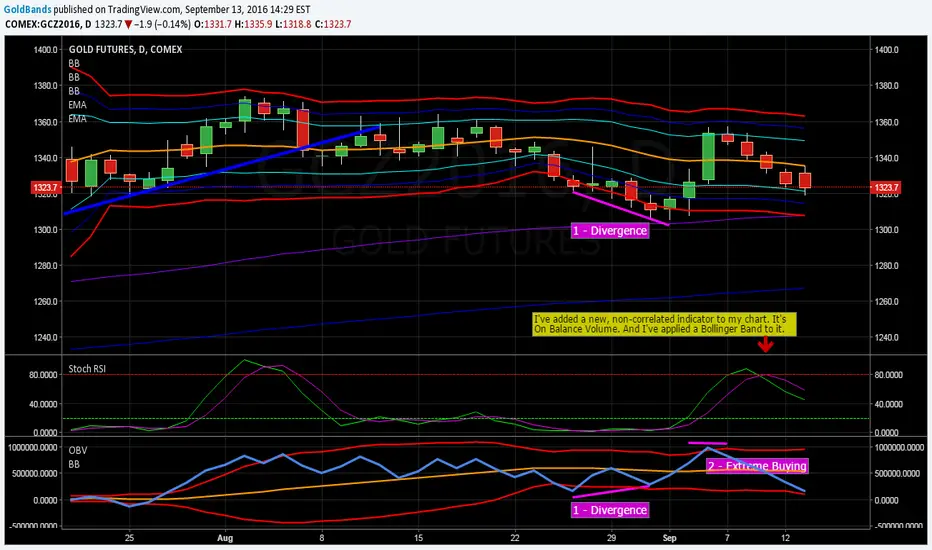
I've added OBV to my chart as a non-correlated indicator. I did this because I wanted a volume indicator as recommended by John Bollinger. I've seen some people add a fast EMA to the indicator but I like how the Bollinger Bands show the extremes.
I've highlighted 2 examples.
1. Classic Divergence - As price exceeded the lower bollinger band in the price fall at the end of August, you can see the OVB make a higher low after it crossed below then back above the lower BB. A nice long trade followed.
2. The first day after Labor Day saw gold have a huge day up. As price hit the upper cyan BB (Std Dev 1.0), the OBV also showed all the buying pressure. That signaled the end of the buying as OBV dropped the next day. You can see that it preceeded the Stoch RSI crossover by a day. GC
GC
I've highlighted 2 examples.
1. Classic Divergence - As price exceeded the lower bollinger band in the price fall at the end of August, you can see the OVB make a higher low after it crossed below then back above the lower BB. A nice long trade followed.
2. The first day after Labor Day saw gold have a huge day up. As price hit the upper cyan BB (Std Dev 1.0), the OBV also showed all the buying pressure. That signaled the end of the buying as OBV dropped the next day. You can see that it preceeded the Stoch RSI crossover by a day.
GC
관련 발행물
면책사항
해당 정보와 게시물은 금융, 투자, 트레이딩 또는 기타 유형의 조언이나 권장 사항으로 간주되지 않으며, 트레이딩뷰에서 제공하거나 보증하는 것이 아닙니다. 자세한 내용은 이용 약관을 참조하세요.
면책사항
해당 정보와 게시물은 금융, 투자, 트레이딩 또는 기타 유형의 조언이나 권장 사항으로 간주되지 않으며, 트레이딩뷰에서 제공하거나 보증하는 것이 아닙니다. 자세한 내용은 이용 약관을 참조하세요.