
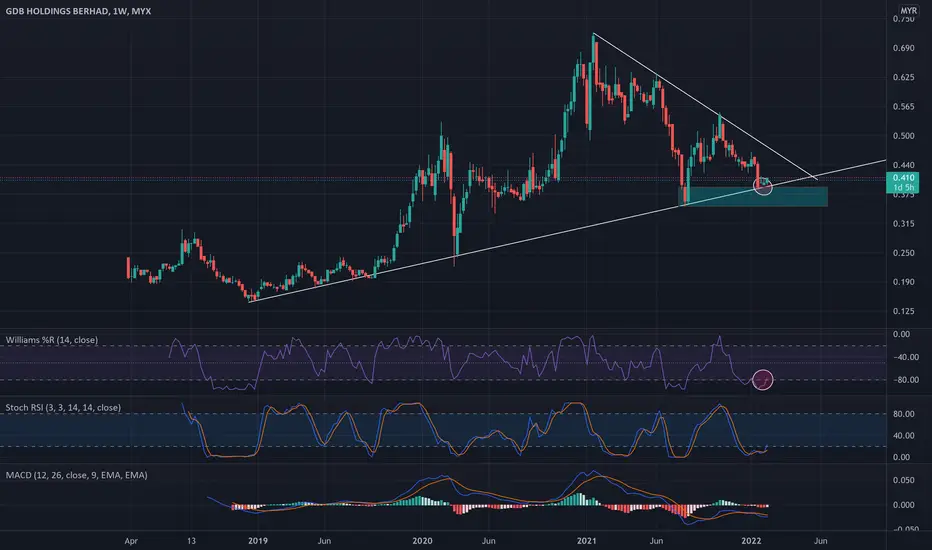
Trend:-
The chart shows a beautiful uptrend for a long term and downtrend for mid term.
According to indicator:-
William r shows that the price has started to turning up and already past -80 line indicated that the price will go up
Stochastic also show that the line has past line 20 and blue line has cross the orange line. Furthermore, the line also has touch line 20 which indicated that price will go up.
As for fundamental:-
This company has low debt
Has a low Earnings Before Interest Tax but never negative in past year
Show a grow in asset every year indicated that the company is growing
you can see it yourself, if you don't believe me
Investment strategy:-
take long term long
take a mid term long

면책사항
해당 정보와 게시물은 금융, 투자, 트레이딩 또는 기타 유형의 조언이나 권장 사항으로 간주되지 않으며, 트레이딩뷰에서 제공하거나 보증하는 것이 아닙니다. 자세한 내용은 이용 약관을 참조하세요.
면책사항
해당 정보와 게시물은 금융, 투자, 트레이딩 또는 기타 유형의 조언이나 권장 사항으로 간주되지 않으며, 트레이딩뷰에서 제공하거나 보증하는 것이 아닙니다. 자세한 내용은 이용 약관을 참조하세요.