
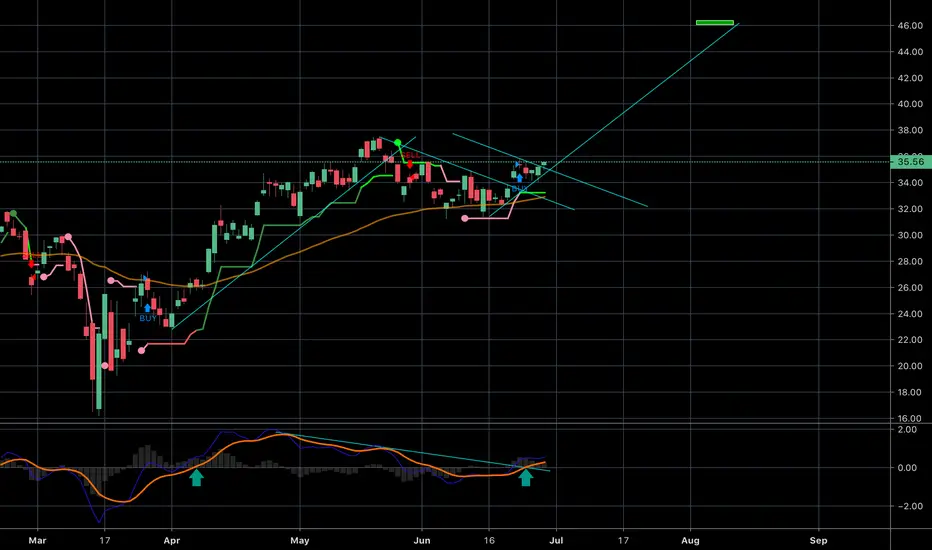
As shown in the daily GDX chart, the turquoise trend lines mark the support resistance trend lines, as well as show a standard flag pattern. Previous upside target in 2019 was 36, it now is upgraded to 46, based on chart pattern and Fibonacci projections.
Recent price action saw a gap above the trend line resistance, and consolidation before yet another gap up (over a minor parallel trend line resistance).
Also observed that MACD is supportive with a break up cross into the bullish territory, and a break above the MACD trend line at about the same time.
Bullish, target 46, around mid-August 2020.
Recent price action saw a gap above the trend line resistance, and consolidation before yet another gap up (over a minor parallel trend line resistance).
Also observed that MACD is supportive with a break up cross into the bullish territory, and a break above the MACD trend line at about the same time.
Bullish, target 46, around mid-August 2020.

관련 발행물
면책사항
해당 정보와 게시물은 금융, 투자, 트레이딩 또는 기타 유형의 조언이나 권장 사항으로 간주되지 않으며, 트레이딩뷰에서 제공하거나 보증하는 것이 아닙니다. 자세한 내용은 이용 약관을 참조하세요.
면책사항
해당 정보와 게시물은 금융, 투자, 트레이딩 또는 기타 유형의 조언이나 권장 사항으로 간주되지 않으며, 트레이딩뷰에서 제공하거나 보증하는 것이 아닙니다. 자세한 내용은 이용 약관을 참조하세요.