
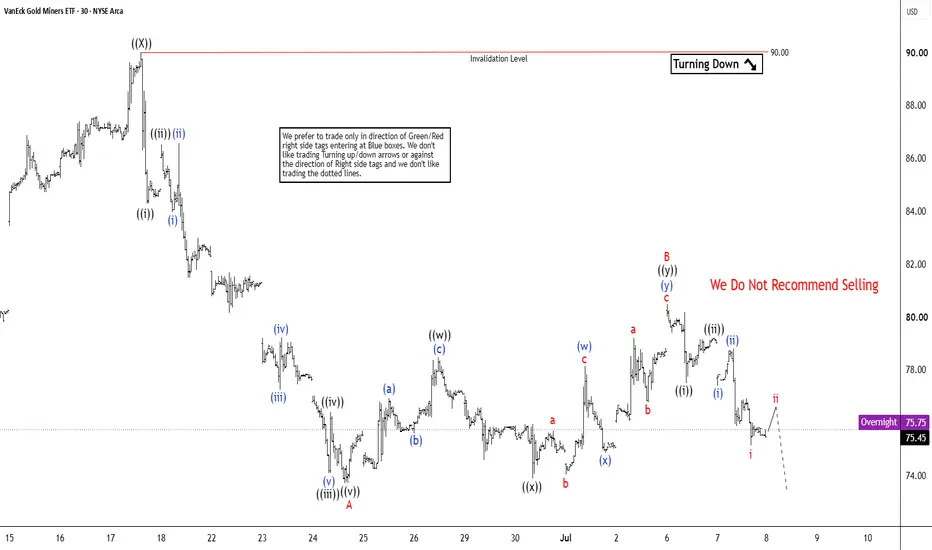
The Gold Miners ETF (GDX) continues to exhibit an incomplete bearish sequence from the March 2, 2026 high, and this structure still favors additional downside. The broader decline retains a clear impulsive and corrective rhythm, which strengthens the case for further weakness before a more durable recovery can emerge. The ideal downside target is measured by the 100% to 161.8% Fibonacci extension taken from the March 2 peak. This region, located at $33 to $59, represents a technically significant support zone where buyers may attempt to establish a three‑wave rally at minimum. The near‑term cycle from the June 18 high remains active and continues to unfold as a zigzag structure.
From the June 18 pivot, wave ((i)) ended at $84.28, followed by a modest recovery in wave ((ii)) that ended at $87.21. The ETF then turned lower in wave ((iii)) toward $74.08, and the subsequent wave ((iv)) rally ended at $76.40. The final leg of the sequence, wave ((v)), reached $73.70, which completed wave A at a higher degree. After that low, wave B developed as a double three structure. Up from wave A, wave ((w)) ended at $78.48, while wave ((x)) concluded at $73.89. The final push higher in wave ((y)) ended at $80.47, completing wave B.
GDX has since resumed its decline. As long as the pivot at $90 remains intact, the broader bearish sequence should continue to extend lower.
From the June 18 pivot, wave ((i)) ended at $84.28, followed by a modest recovery in wave ((ii)) that ended at $87.21. The ETF then turned lower in wave ((iii)) toward $74.08, and the subsequent wave ((iv)) rally ended at $76.40. The final leg of the sequence, wave ((v)), reached $73.70, which completed wave A at a higher degree. After that low, wave B developed as a double three structure. Up from wave A, wave ((w)) ended at $78.48, while wave ((x)) concluded at $73.89. The final push higher in wave ((y)) ended at $80.47, completing wave B.
GDX has since resumed its decline. As long as the pivot at $90 remains intact, the broader bearish sequence should continue to extend lower.

면책사항
해당 정보와 게시물은 금융, 투자, 트레이딩 또는 기타 유형의 조언이나 권장 사항으로 간주되지 않으며, 트레이딩뷰에서 제공하거나 보증하는 것이 아닙니다. 자세한 내용은 이용 약관을 참조하세요.
면책사항
해당 정보와 게시물은 금융, 투자, 트레이딩 또는 기타 유형의 조언이나 권장 사항으로 간주되지 않으며, 트레이딩뷰에서 제공하거나 보증하는 것이 아닙니다. 자세한 내용은 이용 약관을 참조하세요.