
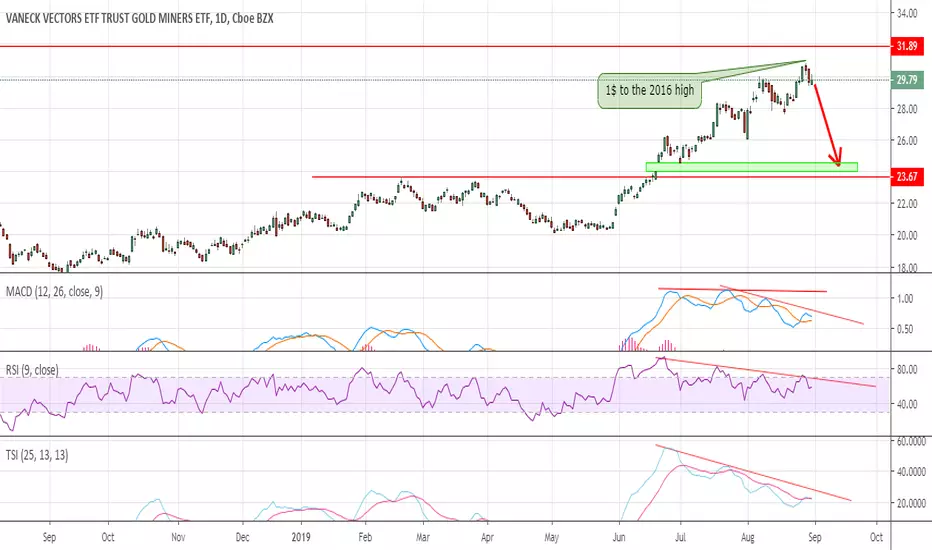
I think the GDX rally is done too.
All the indicators are showing divergencies in GDX.
It rallied almost to the 2016 highs...

We will get a pinbar ( inverted hammer or shooting star ) on the weekly chart.
The weekly chart's indicators need to tag the oversold territory in this decline.
It might close the gap at 24 -24.56 or might test breakout at 23.67$.
All the indicators are showing divergencies in GDX.
It rallied almost to the 2016 highs...
We will get a pinbar ( inverted hammer or shooting star ) on the weekly chart.
The weekly chart's indicators need to tag the oversold territory in this decline.
It might close the gap at 24 -24.56 or might test breakout at 23.67$.
노트
Broke down the trendline today. If it stays there into the close more selling will come on Monday.노트
After today's big bounce we are closing in the red. Big guys dumped their shares to the small guys. I hope nobody bought the fake rally today.
매매 수동청산
노트
Just in case if it turns out to be a double bottom
관련 발행물
면책사항
해당 정보와 게시물은 금융, 투자, 트레이딩 또는 기타 유형의 조언이나 권장 사항으로 간주되지 않으며, 트레이딩뷰에서 제공하거나 보증하는 것이 아닙니다. 자세한 내용은 이용 약관을 참조하세요.
면책사항
해당 정보와 게시물은 금융, 투자, 트레이딩 또는 기타 유형의 조언이나 권장 사항으로 간주되지 않으며, 트레이딩뷰에서 제공하거나 보증하는 것이 아닙니다. 자세한 내용은 이용 약관을 참조하세요.