
Good morning Traders. How was the weekend ? Another trading week will start soon. so let's dig in.
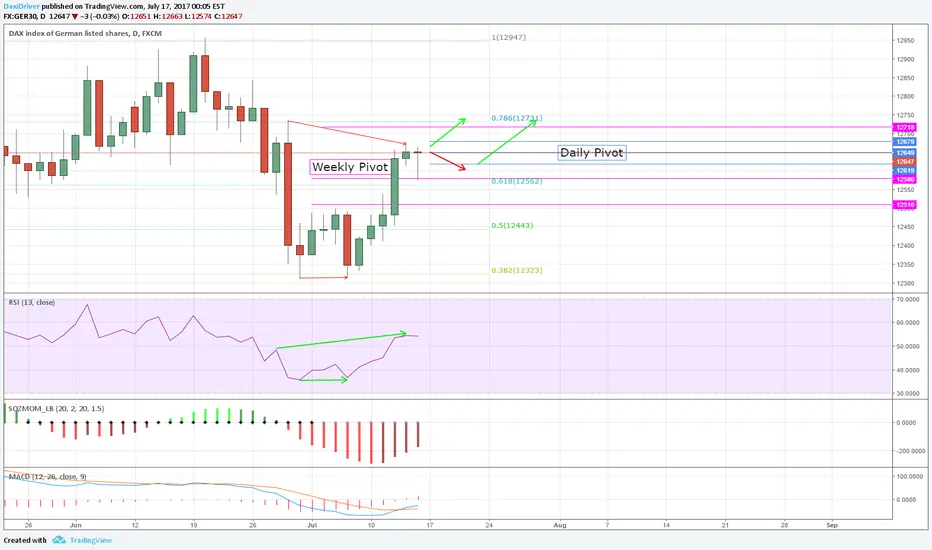
The daily chart look's BULLISH. with US new high, looks like we heading towards 12730 - 12750.
BUT before we run and buy, we should look deeper
The 2hr chart is more BEARISH, so we can expect so some sell before US market opens.
not to mention that US might sell off a bit after weekend rally.
s3.amazonaws.com/tradingview/snapshots/o/OW62dgK6.png
Remember, you dont have to jump in. you can use the WEEKLY and DAILY pivots to try and enter.
the logic with pivots is - if price goes up towards S1 (top line) you might consider sell if it doesn't go above.
if price goes down towards P1 (bottom line) you can consider LONG if it won't breaks below the line.
The daily chart look's BULLISH. with US new high, looks like we heading towards 12730 - 12750.
BUT before we run and buy, we should look deeper
The 2hr chart is more BEARISH, so we can expect so some sell before US market opens.
not to mention that US might sell off a bit after weekend rally.
s3.amazonaws.com/tradingview/snapshots/o/OW62dgK6.png
Remember, you dont have to jump in. you can use the WEEKLY and DAILY pivots to try and enter.
the logic with pivots is - if price goes up towards S1 (top line) you might consider sell if it doesn't go above.
if price goes down towards P1 (bottom line) you can consider LONG if it won't breaks below the line.
노트
I think its going upS&p got more 10 points to give
s3.amazonaws.com/tradingview/snapshots/5/5SBrc3TG.png

면책사항
해당 정보와 게시물은 금융, 투자, 트레이딩 또는 기타 유형의 조언이나 권장 사항으로 간주되지 않으며, 트레이딩뷰에서 제공하거나 보증하는 것이 아닙니다. 자세한 내용은 이용 약관을 참조하세요.
면책사항
해당 정보와 게시물은 금융, 투자, 트레이딩 또는 기타 유형의 조언이나 권장 사항으로 간주되지 않으며, 트레이딩뷰에서 제공하거나 보증하는 것이 아닙니다. 자세한 내용은 이용 약관을 참조하세요.