
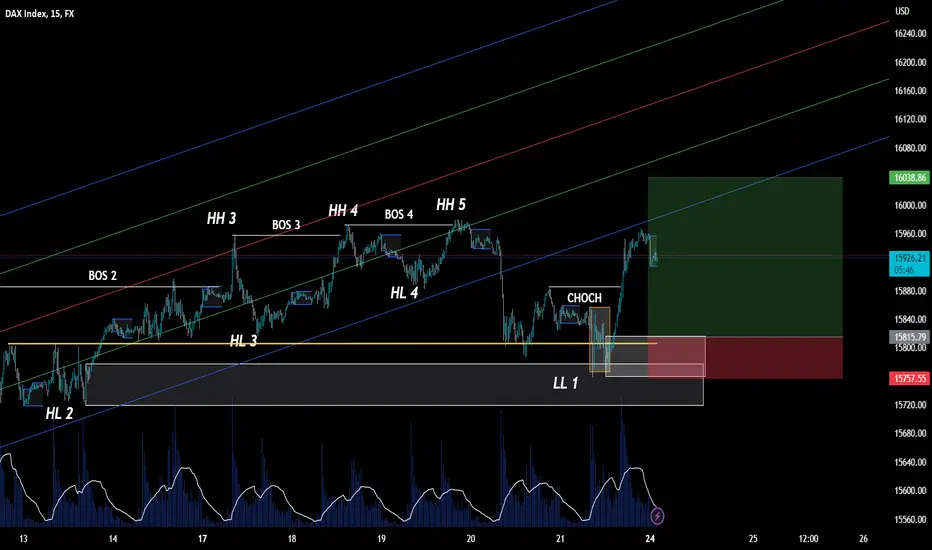
On 3H timeframe:
- Bullish trend
- Parallel channel formed and broken
- Decrement in volume from HH2 to HH5
- Breakout candle with volume but less volume than the one moving back to the upside bars after
- Yellow Line acts as support line with significant reactivity from previous observed price action.
On 15Min timeframe:
- Reaction to demand on HL2, where volume decreases as it falls, when volume kicks in price ranges (orange box) and shifts direction to the upside
- CHOC
- Bullish trend
- Parallel channel formed and broken
- Decrement in volume from HH2 to HH5
- Breakout candle with volume but less volume than the one moving back to the upside bars after
- Yellow Line acts as support line with significant reactivity from previous observed price action.
On 15Min timeframe:
- Reaction to demand on HL2, where volume decreases as it falls, when volume kicks in price ranges (orange box) and shifts direction to the upside
- CHOC
거래청산: 스탑 닿음

면책사항
해당 정보와 게시물은 금융, 투자, 트레이딩 또는 기타 유형의 조언이나 권장 사항으로 간주되지 않으며, 트레이딩뷰에서 제공하거나 보증하는 것이 아닙니다. 자세한 내용은 이용 약관을 참조하세요.
면책사항
해당 정보와 게시물은 금융, 투자, 트레이딩 또는 기타 유형의 조언이나 권장 사항으로 간주되지 않으며, 트레이딩뷰에서 제공하거나 보증하는 것이 아닙니다. 자세한 내용은 이용 약관을 참조하세요.