숏
Ger30 Short
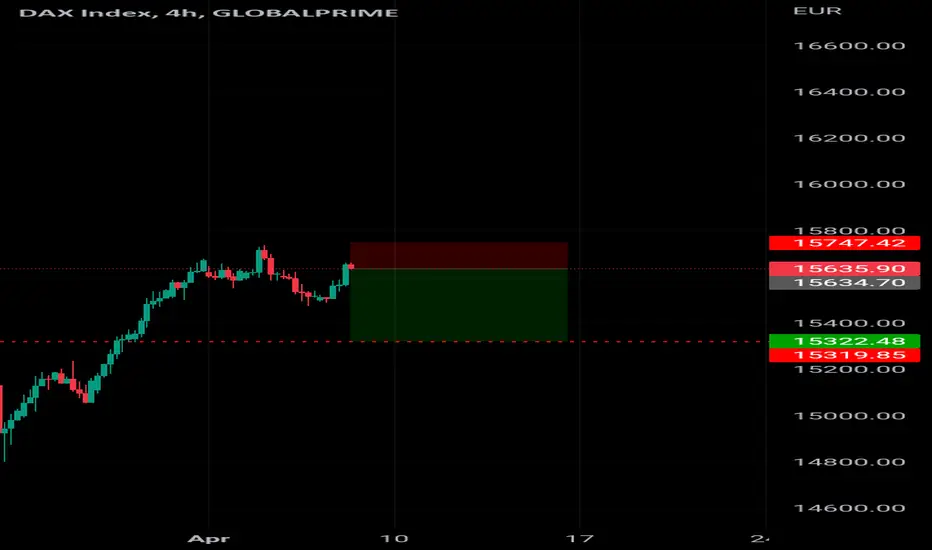
Ger30 Short potential
Short it now
The GER30 daily chart is trading in its bullish channel between its upper blue and red bands. It RSI is trading above 50 (green rectangle). The longer it maintains on the bullish side of 50 the greater the probability of higher prices ahead.
The hourly chart shows a strong start to today's trade. The trend following EMAs and the momentum-based stochastic have turned up (black ellipses). If the stochastic makes its way to the 80+ levels (blue arrow) and holds it will denote a strong underlying bullish momentum is present.

면책사항
해당 정보와 게시물은 금융, 투자, 트레이딩 또는 기타 유형의 조언이나 권장 사항으로 간주되지 않으며, 트레이딩뷰에서 제공하거나 보증하는 것이 아닙니다. 자세한 내용은 이용 약관을 참조하세요.
면책사항
해당 정보와 게시물은 금융, 투자, 트레이딩 또는 기타 유형의 조언이나 권장 사항으로 간주되지 않으며, 트레이딩뷰에서 제공하거나 보증하는 것이 아닙니다. 자세한 내용은 이용 약관을 참조하세요.