
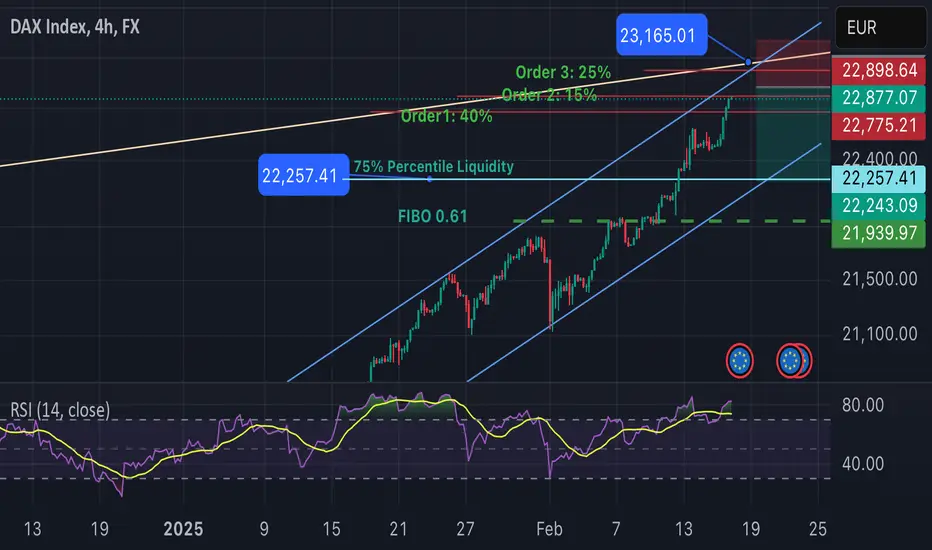
. Trend Lines and Moving Averages:
• Moving Averages (MA): Check the 50-day and 200-day moving averages. DAX is trading above these averages and the 50-day is above the 200-day, that generally indicates an upward trend. A crossover (where the 50-day falls below the 200-day) might suggest a shift to a bearish trend. Stay tuned!!
• Trend Lines: Draw trend lines connecting recent highs & lows. An upward-sloping trend line suggests bullish momentum, Which, in reality triggers an alarm for shortterm buyers to start selling and waiting for a pull back to buy cheaper by waiting downward-sloping bearish pressure.
2. Relative Strength Index (RSI):
• An RSI above 70 typically indicates that the asset might be overbought, suggesting a possible pullback or consolidation.

면책사항
해당 정보와 게시물은 금융, 투자, 트레이딩 또는 기타 유형의 조언이나 권장 사항으로 간주되지 않으며, 트레이딩뷰에서 제공하거나 보증하는 것이 아닙니다. 자세한 내용은 이용 약관을 참조하세요.
면책사항
해당 정보와 게시물은 금융, 투자, 트레이딩 또는 기타 유형의 조언이나 권장 사항으로 간주되지 않으며, 트레이딩뷰에서 제공하거나 보증하는 것이 아닙니다. 자세한 내용은 이용 약관을 참조하세요.