
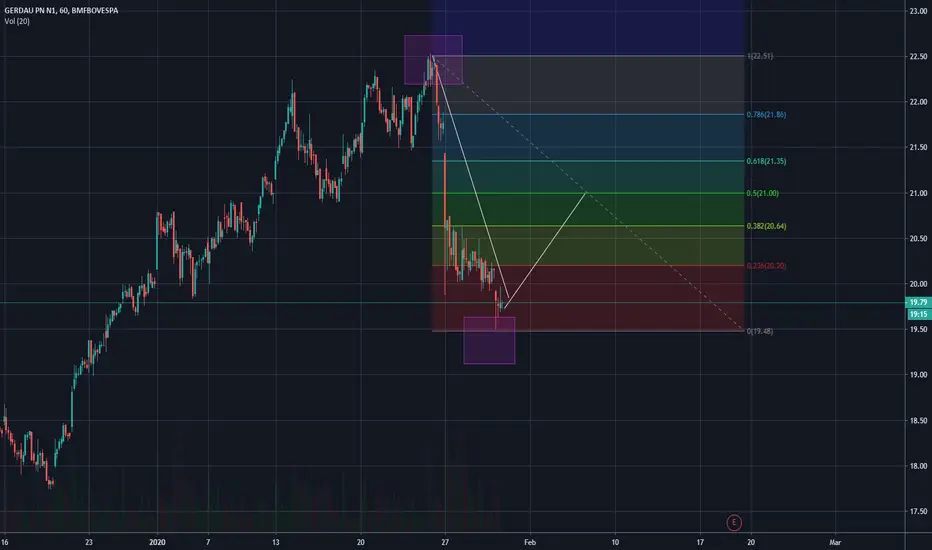
Rectangles represent the maximum and minimum values.
The white line represents the movement that I assume will happen.
The white line represents the movement that I assume will happen.
노트
Therefore there was a rise up to 0.382, whete my exit point should have been. The line did not cross 0.5, so I will assume it will continue on a low trend.노트
After the 0.382 retraction, the candles reached 0.5 fibonacci, where was my point of sale.I bought at 19.80 and sold at 20.95 making a 6% profit.

면책사항
해당 정보와 게시물은 금융, 투자, 트레이딩 또는 기타 유형의 조언이나 권장 사항으로 간주되지 않으며, 트레이딩뷰에서 제공하거나 보증하는 것이 아닙니다. 자세한 내용은 이용 약관을 참조하세요.
면책사항
해당 정보와 게시물은 금융, 투자, 트레이딩 또는 기타 유형의 조언이나 권장 사항으로 간주되지 않으며, 트레이딩뷰에서 제공하거나 보증하는 것이 아닙니다. 자세한 내용은 이용 약관을 참조하세요.