$GLCH projection based on the LOG chart
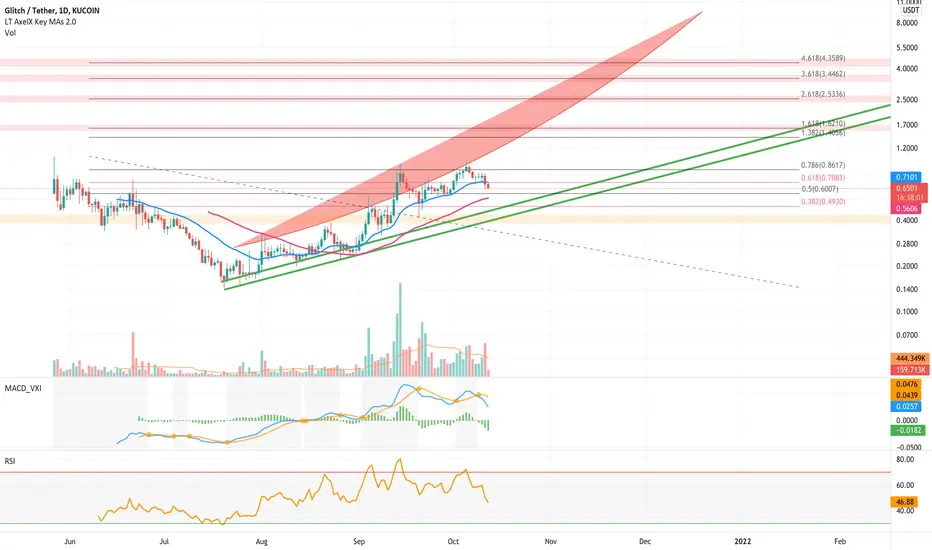
My previous model on GGCH is broken, this model only looked at linear data. Since most of the moves in crypto are exponential most of the times. It could be better to take the LOG chart in consideration...
In this chart potential upside and downside is greater.
The support band of the LOG chart shows a potential bottom between $0.47 - $0.40.
In this chart potential upside and downside is greater.
The support band of the LOG chart shows a potential bottom between $0.47 - $0.40.

면책사항
해당 정보와 게시물은 금융, 투자, 트레이딩 또는 기타 유형의 조언이나 권장 사항으로 간주되지 않으며, 트레이딩뷰에서 제공하거나 보증하는 것이 아닙니다. 자세한 내용은 이용 약관을 참조하세요.
면책사항
해당 정보와 게시물은 금융, 투자, 트레이딩 또는 기타 유형의 조언이나 권장 사항으로 간주되지 않으며, 트레이딩뷰에서 제공하거나 보증하는 것이 아닙니다. 자세한 내용은 이용 약관을 참조하세요.