
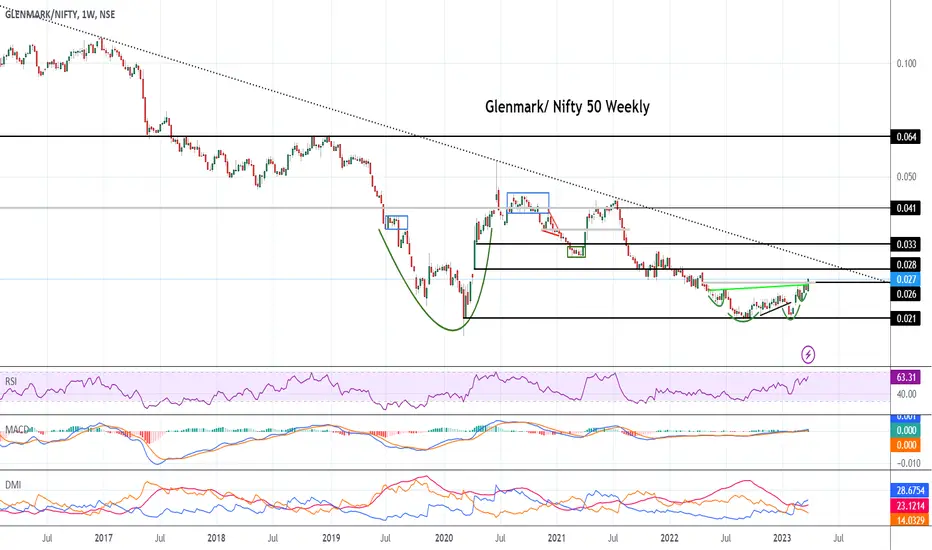
Attached: Glenmark/ Nifty 50 Weekly Chart as of 31st March 2023
This Relative Strength (Ratio) Chart clearly shows the Outperformance of Glenmark over Nifty 50 has Started!
The Ratio Chart has given an Inverted Head & Shoulders Breakout with this Week's Candle Close
If you compared Glenmark and Nifty 50 both on a Year To Date basis for 2023, then we get:
Glenmark= Up 9.56% YTD
Nifty 50= Down Down 4.12% YTD
What this Means is that:
Going forward expect Glenmark to keep Outperforming Nifty 50
Your Money is better off Invested in an Outperforming Stock instead of Index Nifty 50
Glenmark Pharma can be one of the Leading Stocks for 2023
This has clear BULLISH Implications for the Stock Price
.................
Refer to my Related Ideas to see the Analysis of Glenmark's Price Chart which also has Bullish Implications like this Ratio Chart
This Relative Strength (Ratio) Chart clearly shows the Outperformance of Glenmark over Nifty 50 has Started!
The Ratio Chart has given an Inverted Head & Shoulders Breakout with this Week's Candle Close
If you compared Glenmark and Nifty 50 both on a Year To Date basis for 2023, then we get:
Glenmark= Up 9.56% YTD
Nifty 50= Down Down 4.12% YTD
What this Means is that:
Going forward expect Glenmark to keep Outperforming Nifty 50
Your Money is better off Invested in an Outperforming Stock instead of Index Nifty 50
Glenmark Pharma can be one of the Leading Stocks for 2023
This has clear BULLISH Implications for the Stock Price
.................
Refer to my Related Ideas to see the Analysis of Glenmark's Price Chart which also has Bullish Implications like this Ratio Chart

Siddharth Bhansali
✔️Twitter Handle @T_Harth
✔️Twitter Handle @T_Harth
관련 발행물
면책사항
해당 정보와 게시물은 금융, 투자, 트레이딩 또는 기타 유형의 조언이나 권장 사항으로 간주되지 않으며, 트레이딩뷰에서 제공하거나 보증하는 것이 아닙니다. 자세한 내용은 이용 약관을 참조하세요.
Siddharth Bhansali
✔️Twitter Handle @T_Harth
✔️Twitter Handle @T_Harth
관련 발행물
면책사항
해당 정보와 게시물은 금융, 투자, 트레이딩 또는 기타 유형의 조언이나 권장 사항으로 간주되지 않으며, 트레이딩뷰에서 제공하거나 보증하는 것이 아닙니다. 자세한 내용은 이용 약관을 참조하세요.