롱
Multi-Timeframe Analysis: GM
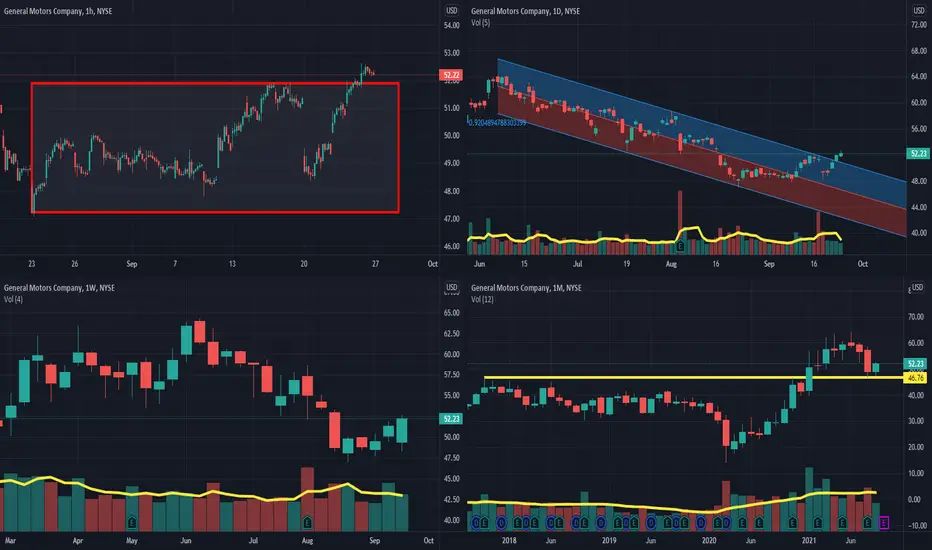
Multi-Timeframe Analysis:
Hourly Chart: getting out of consolidation pattern ( Bullish )
Daily Chart: getting out of downward regression channel + Three white soldiers pattern ( Bullish )
Trading volume in comparison to the last 5 days:
Weekly Chart: Bullish Outside bar
Trading volume in comparison to the last 4 weeks:+4%
Monthly Chart: Price action to support level.
Trading volume in comparison to the last 12 months:
Conclusion: I believe GM could take its previous top back, and even move further..!

Use the following link to access trading ideas: patreon.com/SniperTraderStocks?utm_medium=unknown&utm_source=join_link&utm_campaign=creatorshare_creator&utm_content=copyLink
면책사항
해당 정보와 게시물은 금융, 투자, 트레이딩 또는 기타 유형의 조언이나 권장 사항으로 간주되지 않으며, 트레이딩뷰에서 제공하거나 보증하는 것이 아닙니다. 자세한 내용은 이용 약관을 참조하세요.
Use the following link to access trading ideas: patreon.com/SniperTraderStocks?utm_medium=unknown&utm_source=join_link&utm_campaign=creatorshare_creator&utm_content=copyLink
면책사항
해당 정보와 게시물은 금융, 투자, 트레이딩 또는 기타 유형의 조언이나 권장 사항으로 간주되지 않으며, 트레이딩뷰에서 제공하거나 보증하는 것이 아닙니다. 자세한 내용은 이용 약관을 참조하세요.