업데이트됨
Golem Trend Change
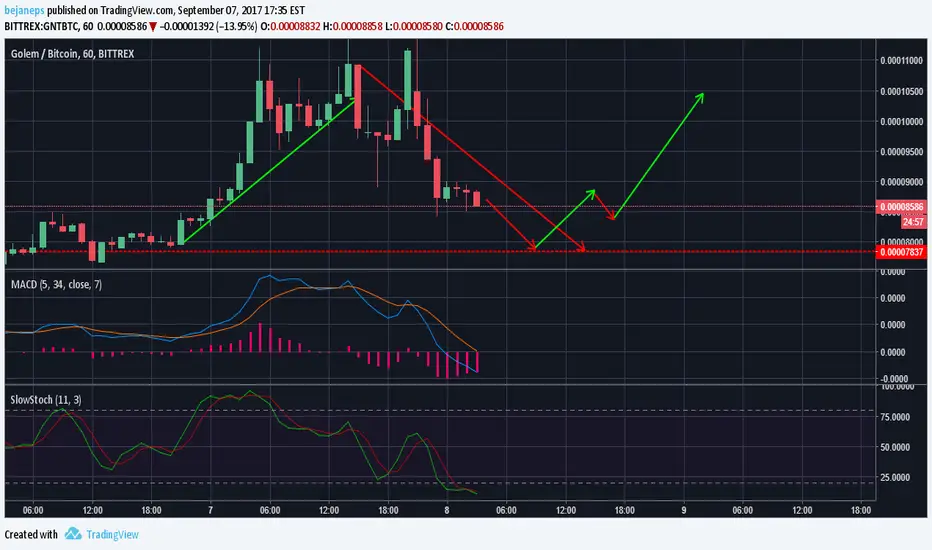
General: approximately in 4-12 hours we can capture trend change. Price will go down till support line or a bit higher than support. Waiting for MACD Indicator to change DMI+ and DMI- lines.
Indicators: MACD showing that histogram is getting weaker and distance between DMI+ and DMI+ is decreasing. By looking at Slow Stochastic we can observe that fast line is jumping from lower limit.
Profit: Take profit on 10%-20% and put your stop-limits at support line.
Good luck and take care !
Indicators: MACD showing that histogram is getting weaker and distance between DMI+ and DMI+ is decreasing. By looking at Slow Stochastic we can observe that fast line is jumping from lower limit.
Profit: Take profit on 10%-20% and put your stop-limits at support line.
Good luck and take care !
액티브 트레이드
Waiting for trend change, keep your coins.매매 수동청산
Bad qualified conference from Golem team, price effected greatly.
면책사항
해당 정보와 게시물은 금융, 투자, 트레이딩 또는 기타 유형의 조언이나 권장 사항으로 간주되지 않으며, 트레이딩뷰에서 제공하거나 보증하는 것이 아닙니다. 자세한 내용은 이용 약관을 참조하세요.
면책사항
해당 정보와 게시물은 금융, 투자, 트레이딩 또는 기타 유형의 조언이나 권장 사항으로 간주되지 않으며, 트레이딩뷰에서 제공하거나 보증하는 것이 아닙니다. 자세한 내용은 이용 약관을 참조하세요.