
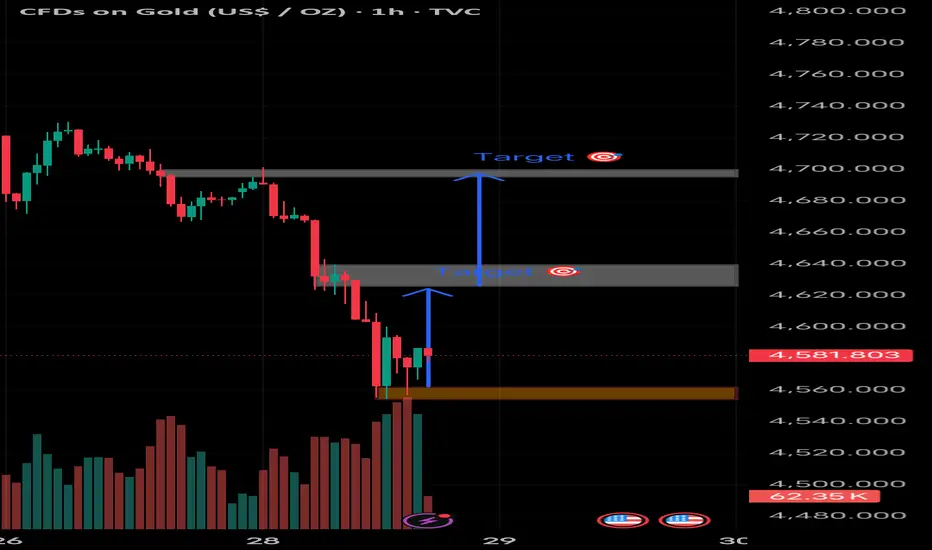
1H Chart 4,550–4,560 and I have marked two upside targets. Based on that structure:
Short-term upside targets:
Target 1: 4,620–4,640 (first supply / reaction zone)
Target 2: 4,690–4,710 (major resistance / previous breakdown area)
How to think about it:
The first target is the most realistic if this is just a relief bounce in a downtrend.
The second target likely needs stronger momentum or a shift in structure (higher highs forming).
Important context:
Trend is still bearish (clear lower highs + strong selloff), so these are counter-trend targets unless structure flips.
If price loses 4,550, my setup is invalid and downside continuation is likely.
Short-term upside targets:
Target 1: 4,620–4,640 (first supply / reaction zone)
Target 2: 4,690–4,710 (major resistance / previous breakdown area)
How to think about it:
The first target is the most realistic if this is just a relief bounce in a downtrend.
The second target likely needs stronger momentum or a shift in structure (higher highs forming).
Important context:
Trend is still bearish (clear lower highs + strong selloff), so these are counter-trend targets unless structure flips.
If price loses 4,550, my setup is invalid and downside continuation is likely.

관련 발행물
면책사항
해당 정보와 게시물은 금융, 투자, 트레이딩 또는 기타 유형의 조언이나 권장 사항으로 간주되지 않으며, 트레이딩뷰에서 제공하거나 보증하는 것이 아닙니다. 자세한 내용은 이용 약관을 참조하세요.
관련 발행물
면책사항
해당 정보와 게시물은 금융, 투자, 트레이딩 또는 기타 유형의 조언이나 권장 사항으로 간주되지 않으며, 트레이딩뷰에서 제공하거나 보증하는 것이 아닙니다. 자세한 내용은 이용 약관을 참조하세요.