
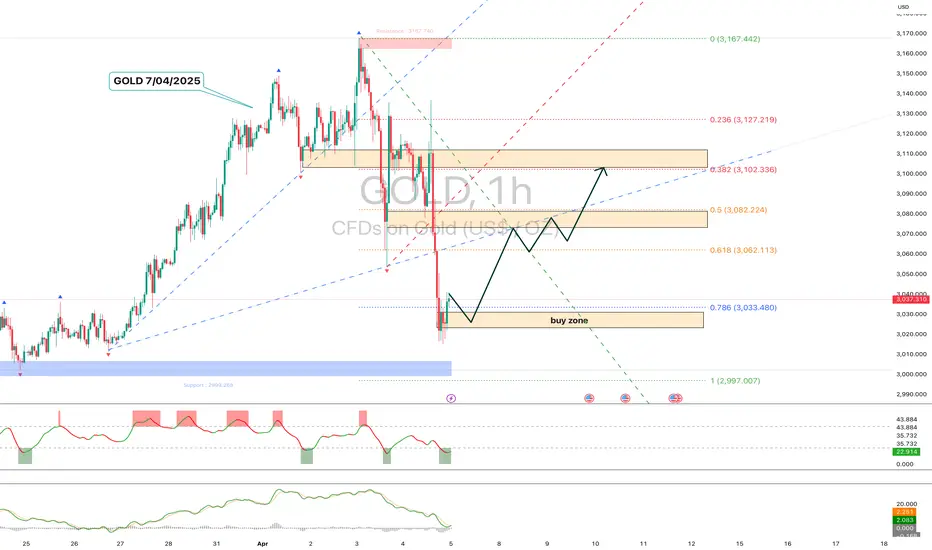
After a sharp drop, price reached the key demand zone around 3025-3030. This area forms a potential buy zone from which a rebound toward 3080–3100 may occur. The chart suggests a possible W-shaped recovery. A breakout above 3100 could unlock further upside toward 3127 and then resistance at 3167.
However, a breakdown below 3015–3020 could increase bearish pressure and lead to a decline toward 2997 support. Indicators are showing signs of local oversold conditions, hinting at potential technical recovery.
Main scenario – reversal from 3025-3030 with a move toward 3080–3100.
Alternative – breakdown to 2997.
However, a breakdown below 3015–3020 could increase bearish pressure and lead to a decline toward 2997 support. Indicators are showing signs of local oversold conditions, hinting at potential technical recovery.
Main scenario – reversal from 3025-3030 with a move toward 3080–3100.
Alternative – breakdown to 2997.

Наш канал: t.me/totoshkatradingteam
⏺ Брокеры которым доверяю:
FxPro - ib-fxpro.com/?ib=SwHtc7m3
AMarkets - profit-market.info/promo/?g=BZA6ZC
⏺ Брокеры которым доверяю:
FxPro - ib-fxpro.com/?ib=SwHtc7m3
AMarkets - profit-market.info/promo/?g=BZA6ZC
면책사항
해당 정보와 게시물은 금융, 투자, 트레이딩 또는 기타 유형의 조언이나 권장 사항으로 간주되지 않으며, 트레이딩뷰에서 제공하거나 보증하는 것이 아닙니다. 자세한 내용은 이용 약관을 참조하세요.
Наш канал: t.me/totoshkatradingteam
⏺ Брокеры которым доверяю:
FxPro - ib-fxpro.com/?ib=SwHtc7m3
AMarkets - profit-market.info/promo/?g=BZA6ZC
⏺ Брокеры которым доверяю:
FxPro - ib-fxpro.com/?ib=SwHtc7m3
AMarkets - profit-market.info/promo/?g=BZA6ZC
면책사항
해당 정보와 게시물은 금융, 투자, 트레이딩 또는 기타 유형의 조언이나 권장 사항으로 간주되지 않으며, 트레이딩뷰에서 제공하거나 보증하는 것이 아닙니다. 자세한 내용은 이용 약관을 참조하세요.