
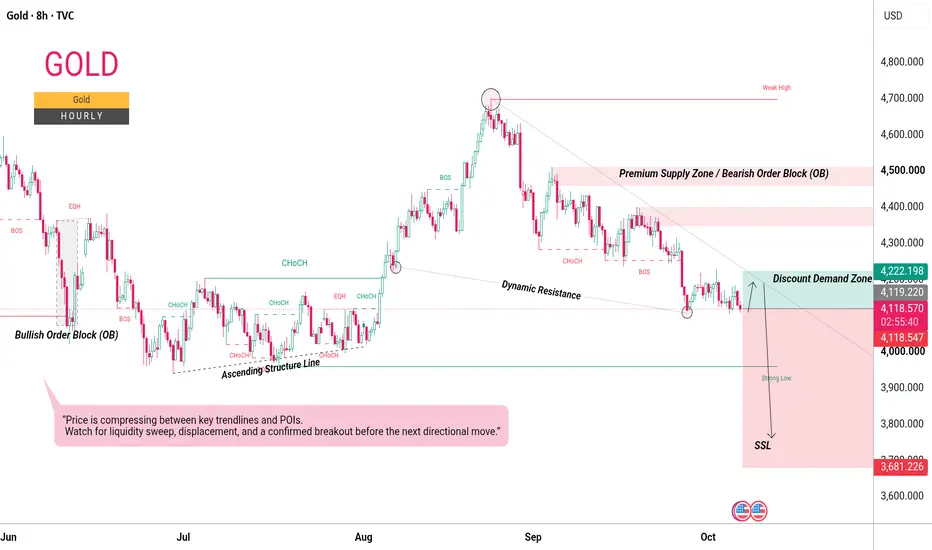
This chart highlights the key market structure, trendlines, and significant price levels that may influence the next market move. The descending trendline represents dynamic resistance, while the ascending trendline acts as a potential support level. Key areas such as the 4,500 Premium Supply Zone and the 4,197 Demand Zone are important points of interest where price may react. Below the current structure, 3,758 represents a potential Sell-Side Liquidity (SSL) target. Traders should monitor these zones for liquidity sweeps, strong displacement, and a confirmed break of structure (BOS) or change of character (CHoCH). A decisive breakout or rejection from these levels could help establish the next directional bias. Until confirmation appears, patience and proper risk management remain essential.
액티브 트레이드
Market is following the predicted path, and further continuation remains possible. Hold and wait for the next move. Stay patient and let the setup play out according to the planned structure.거래청산: 타겟 닿음

관련 발행물
면책사항
해당 정보와 게시물은 금융, 투자, 트레이딩 또는 기타 유형의 조언이나 권장 사항으로 간주되지 않으며, 트레이딩뷰에서 제공하거나 보증하는 것이 아닙니다. 자세한 내용은 이용 약관을 참조하세요.
관련 발행물
면책사항
해당 정보와 게시물은 금융, 투자, 트레이딩 또는 기타 유형의 조언이나 권장 사항으로 간주되지 않으며, 트레이딩뷰에서 제공하거나 보증하는 것이 아닙니다. 자세한 내용은 이용 약관을 참조하세요.