
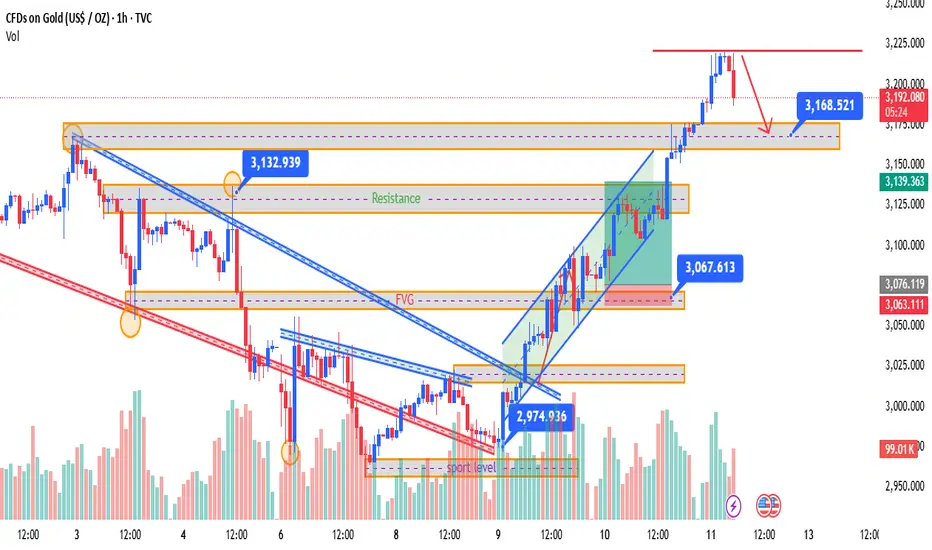
This 1-hour chart of Gold (XAU/USD) presents a detailed technical outlook showing a bullish breakout from a downtrend, followed by a strong rally, and a potential upcoming retracement.
Key highlights from the chart:
- The price previously broke out from a descending trendline, confirmed by the breakout above the 3,132.939 resistance level, followed by a continuation of the uptrend.
- The chart shows multiple FVGs (Fair Value Gaps) and support/resistance zones, which have been respected throughout the price movement.
- After bottoming out around 2,974.936, Gold began a bullish rally, forming higher highs and breaking past the 3,067.613 and 3,139.363 levels.
- The recent high around 3,220 marks a resistance zone, where price has currently stalled and is showing …
The volume profile shows a strong increase during bullish movements, indicating strong buyer interest. Traders will be watching the 3,168–3,150 zone closely—if it holds as support, it may offer a fresh opportunity for long positions toward a retest of 3,220 or higher. However, a break below this zone could signal a deeper correction.
Summary:
- Trend: Bullish
- Current Action: Pullback from resistance
- Watch Support: 3,168.521
- Potential Setup: Buy on pullback if support holds, otherwise wait for confirmation before re-entry.
Key highlights from the chart:
- The price previously broke out from a descending trendline, confirmed by the breakout above the 3,132.939 resistance level, followed by a continuation of the uptrend.
- The chart shows multiple FVGs (Fair Value Gaps) and support/resistance zones, which have been respected throughout the price movement.
- After bottoming out around 2,974.936, Gold began a bullish rally, forming higher highs and breaking past the 3,067.613 and 3,139.363 levels.
- The recent high around 3,220 marks a resistance zone, where price has currently stalled and is showing …
The volume profile shows a strong increase during bullish movements, indicating strong buyer interest. Traders will be watching the 3,168–3,150 zone closely—if it holds as support, it may offer a fresh opportunity for long positions toward a retest of 3,220 or higher. However, a break below this zone could signal a deeper correction.
Summary:
- Trend: Bullish
- Current Action: Pullback from resistance
- Watch Support: 3,168.521
- Potential Setup: Buy on pullback if support holds, otherwise wait for confirmation before re-entry.

면책사항
해당 정보와 게시물은 금융, 투자, 트레이딩 또는 기타 유형의 조언이나 권장 사항으로 간주되지 않으며, 트레이딩뷰에서 제공하거나 보증하는 것이 아닙니다. 자세한 내용은 이용 약관을 참조하세요.
면책사항
해당 정보와 게시물은 금융, 투자, 트레이딩 또는 기타 유형의 조언이나 권장 사항으로 간주되지 않으며, 트레이딩뷰에서 제공하거나 보증하는 것이 아닙니다. 자세한 내용은 이용 약관을 참조하세요.