
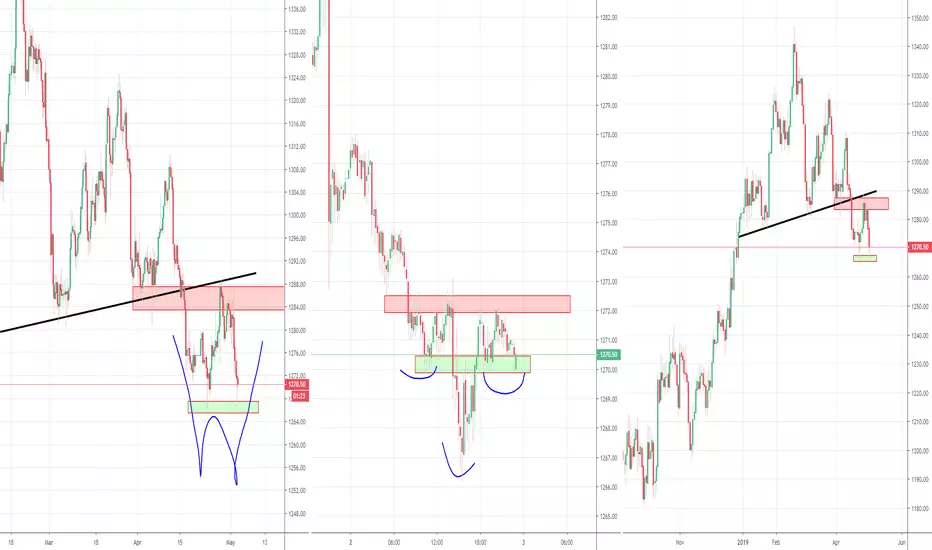
Usually, for an H&S, you don't want to see the right shoulder get below the low of the left shoulder. The right shoulder is getting a bit big now, but it's low time frame so it can still happen. This is how i sometimes find my setups, seeing a pattern in the making, then zooming in to find some confirmation for it and that i strike when i get enough confirmation to validate my R/R
For this one, don't forget we have the mid-term trend against us right now. So i always adjust my sizes on these facts. As mentioned (in my channels), safe play is waiting for the neckline to break.
On the left we can see a potential double bottom as mentioned, those 2 wicks at the lows can be big signs sometimes, so together with this inverse H&S, trying to catch a nice entry on a potential great trade. Because if the double bottom is real, the target is around 1310. But a big road ahead before we can start to think of those prices. So what i tend to do is, risk a small size at the breakout, when seeing a good bull flag around the neckline of the W bottom (like i showed with ETH a few days ago), than i increase the size. So risking a small amount for a potential big trade.
Also when looking at my previous analysis, it seems to be finding support at that trend line.
Previous analysis:
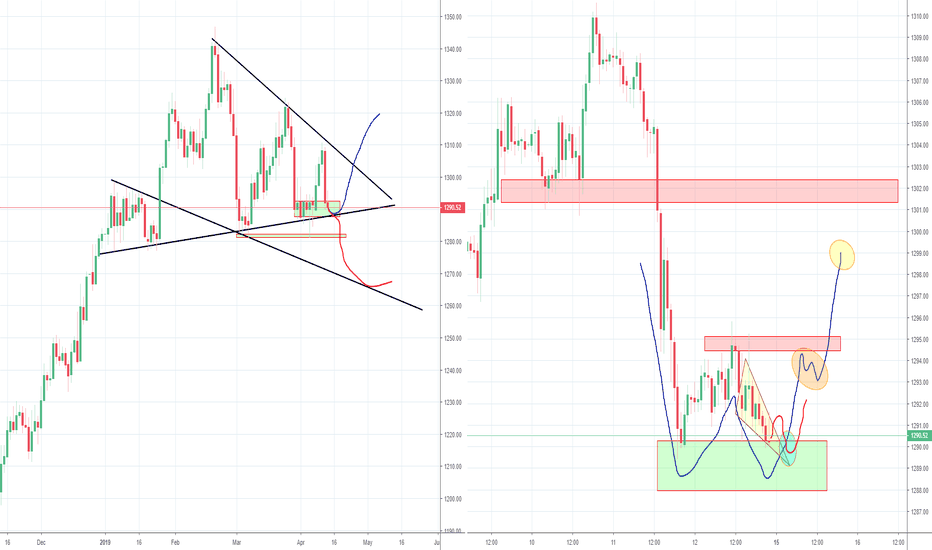
For this one, don't forget we have the mid-term trend against us right now. So i always adjust my sizes on these facts. As mentioned (in my channels), safe play is waiting for the neckline to break.
On the left we can see a potential double bottom as mentioned, those 2 wicks at the lows can be big signs sometimes, so together with this inverse H&S, trying to catch a nice entry on a potential great trade. Because if the double bottom is real, the target is around 1310. But a big road ahead before we can start to think of those prices. So what i tend to do is, risk a small size at the breakout, when seeing a good bull flag around the neckline of the W bottom (like i showed with ETH a few days ago), than i increase the size. So risking a small amount for a potential big trade.
Also when looking at my previous analysis, it seems to be finding support at that trend line.
Previous analysis:
노트
Perfect, looking awesome now :). Still potential for a lower high here, to form like a triangle as shown on the left. But those odds at this point are 25%. So ideally we see a bull flag form rest of the day close to the high, than the double bottom is probably in play and we can see follow through next week.노트
This opening worked in our favor, broke up from the bull flag, which has a target around 1290. So far this one is working out very good. Now if we see it hang between 1281 and 1288 coming day or 2, than the double bottom idea will become very likely.
면책사항
해당 정보와 게시물은 금융, 투자, 트레이딩 또는 기타 유형의 조언이나 권장 사항으로 간주되지 않으며, 트레이딩뷰에서 제공하거나 보증하는 것이 아닙니다. 자세한 내용은 이용 약관을 참조하세요.
면책사항
해당 정보와 게시물은 금융, 투자, 트레이딩 또는 기타 유형의 조언이나 권장 사항으로 간주되지 않으며, 트레이딩뷰에서 제공하거나 보증하는 것이 아닙니다. 자세한 내용은 이용 약관을 참조하세요.