
🟢 Reverse Head & Shoulders on XAUUSD (CFD)
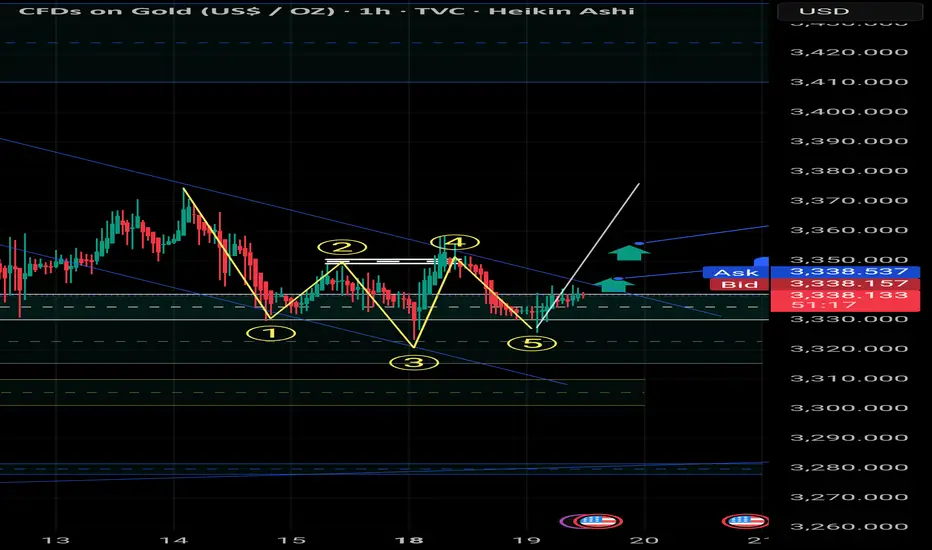
On the 1H chart, the market has recently completed a five-leg structure, which visually aligns with a reverse head & shoulders pattern:
① Left Shoulder: Formed around 3338 with a local support bounce.
② Minor High: First rejection confirming neckline area.
③ Head: The lowest point near 3320, creating a liquidity sweep below previous lows.
④ Right Shoulder: Retesting neckline after liquidity grab.
⑤ Confirmation: Price rejecting higher lows, aligning with bullish order flow.
Key Technical Insights:
Neckline Break: A clean break above the descending neckline (around 3348–3350) could validate the pattern.
Targets:
First target around 3350–3360 (short-term liquidity pool).
Extended target near 3410 if bullish momentum continues.
Invalidation: A drop back below 3320 would invalidate the structure and open the door for deeper bearish continuation.
SMC Context:
The head represents a sweep of liquidity beneath prior lows.
The right shoulder forms with mitigation and BOS signs, suggesting a possible shift in market structure.
If BOS confirms above the neckline, price is likely to fill imbalance zones toward higher liquidity areas.
---
📌 This setup highlights both a classical pattern (reverse H&S) and smart money concepts, merging retail and institutional perspectives for a stronger confirmation bias.
On the 1H chart, the market has recently completed a five-leg structure, which visually aligns with a reverse head & shoulders pattern:
① Left Shoulder: Formed around 3338 with a local support bounce.
② Minor High: First rejection confirming neckline area.
③ Head: The lowest point near 3320, creating a liquidity sweep below previous lows.
④ Right Shoulder: Retesting neckline after liquidity grab.
⑤ Confirmation: Price rejecting higher lows, aligning with bullish order flow.
Key Technical Insights:
Neckline Break: A clean break above the descending neckline (around 3348–3350) could validate the pattern.
Targets:
First target around 3350–3360 (short-term liquidity pool).
Extended target near 3410 if bullish momentum continues.
Invalidation: A drop back below 3320 would invalidate the structure and open the door for deeper bearish continuation.
SMC Context:
The head represents a sweep of liquidity beneath prior lows.
The right shoulder forms with mitigation and BOS signs, suggesting a possible shift in market structure.
If BOS confirms above the neckline, price is likely to fill imbalance zones toward higher liquidity areas.
---
📌 This setup highlights both a classical pattern (reverse H&S) and smart money concepts, merging retail and institutional perspectives for a stronger confirmation bias.

면책사항
해당 정보와 게시물은 금융, 투자, 트레이딩 또는 기타 유형의 조언이나 권장 사항으로 간주되지 않으며, 트레이딩뷰에서 제공하거나 보증하는 것이 아닙니다. 자세한 내용은 이용 약관을 참조하세요.
면책사항
해당 정보와 게시물은 금융, 투자, 트레이딩 또는 기타 유형의 조언이나 권장 사항으로 간주되지 않으며, 트레이딩뷰에서 제공하거나 보증하는 것이 아닙니다. 자세한 내용은 이용 약관을 참조하세요.